View Trace Records
Use the Verrazzano Jaeger console to view, query, and filter traces. For information on how to get the Verrazzano Jaeger console URL and credentials, see Access Verrazzano.
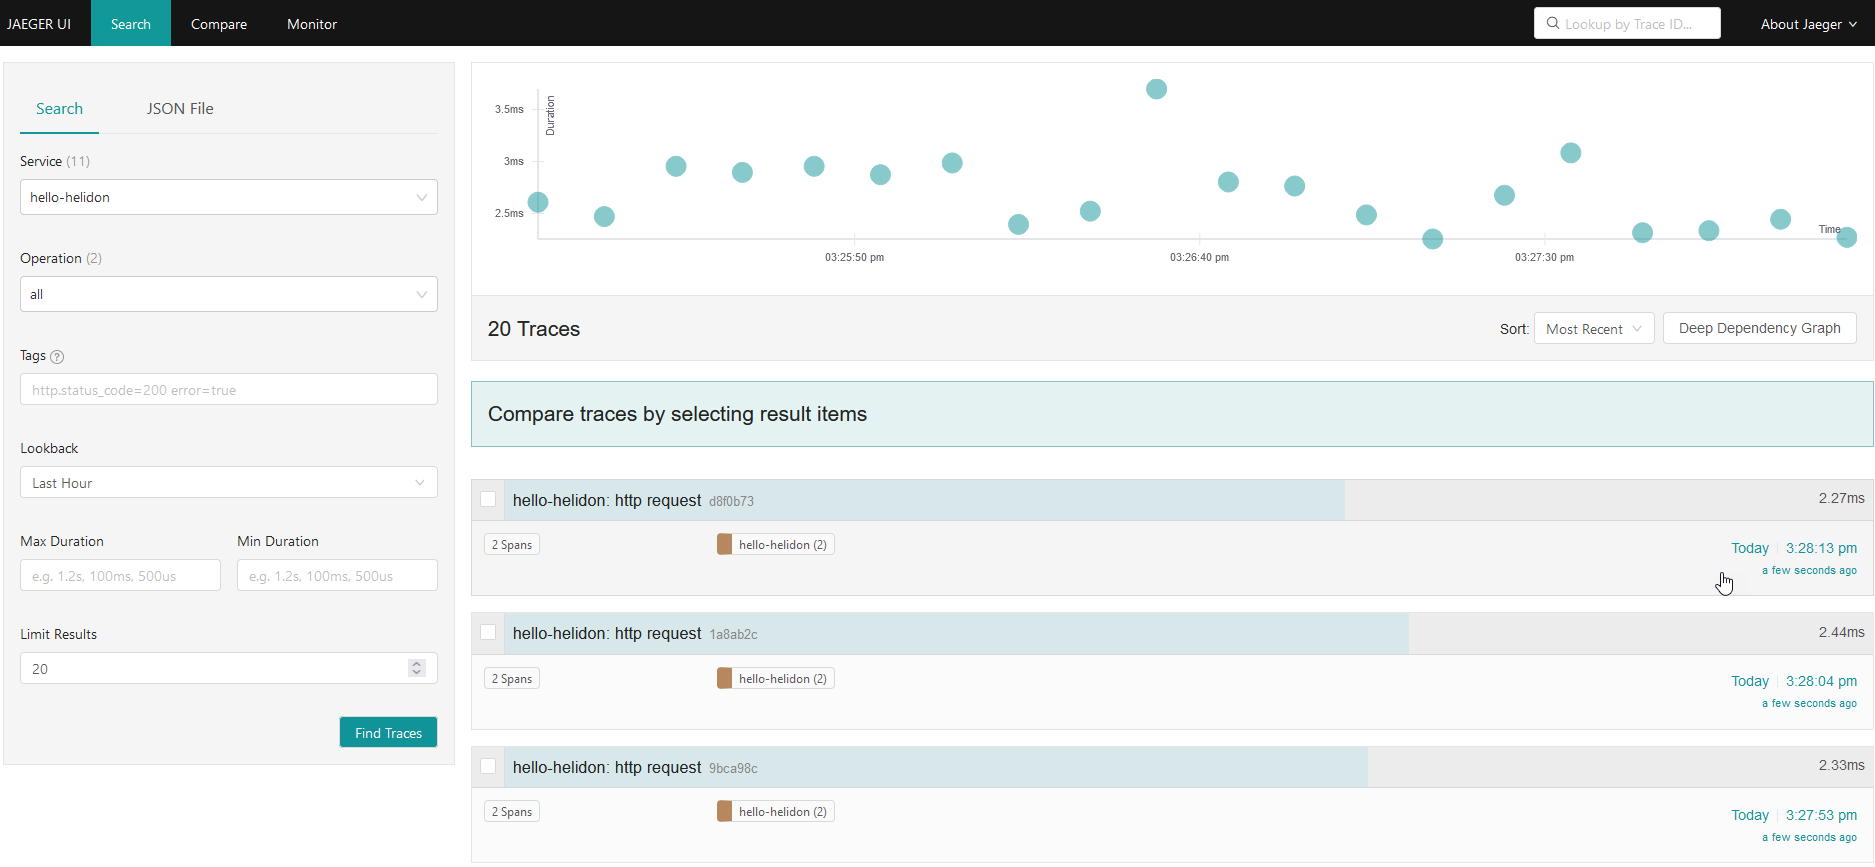
View traces in the Jaeger console
On the initial page, select the service name to display the traces that you want to evaluate, for example, hello-helidon.
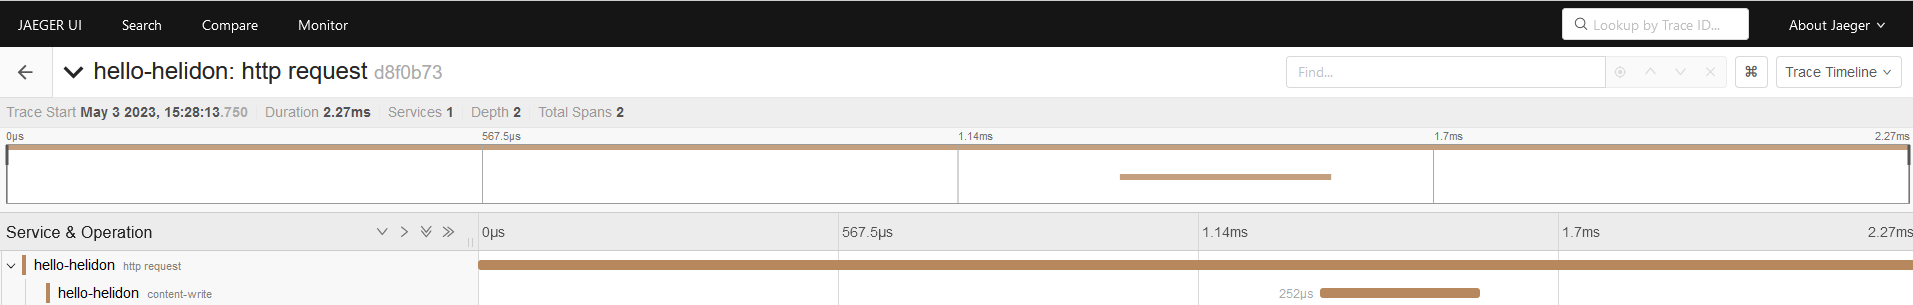
Select a trace to see its details.
To filter the number of responses, add a filtering option by specifying a tag element to be a part of the search criteria.
The Jaeger console shows:
- All the spans that make up the trace.
- Each span will contain all the tags, events, and timings for that span.
- Each span can be expanded to see the values of the tags, events, and the start time, end time, and the overall duration of the span.
View managed cluster traces
You can see the managed cluster traces from the Jaeger console in the admin cluster only. To find the Jaeger console URL for your admin cluster, follow the instructions for Accessing Verrazzano.
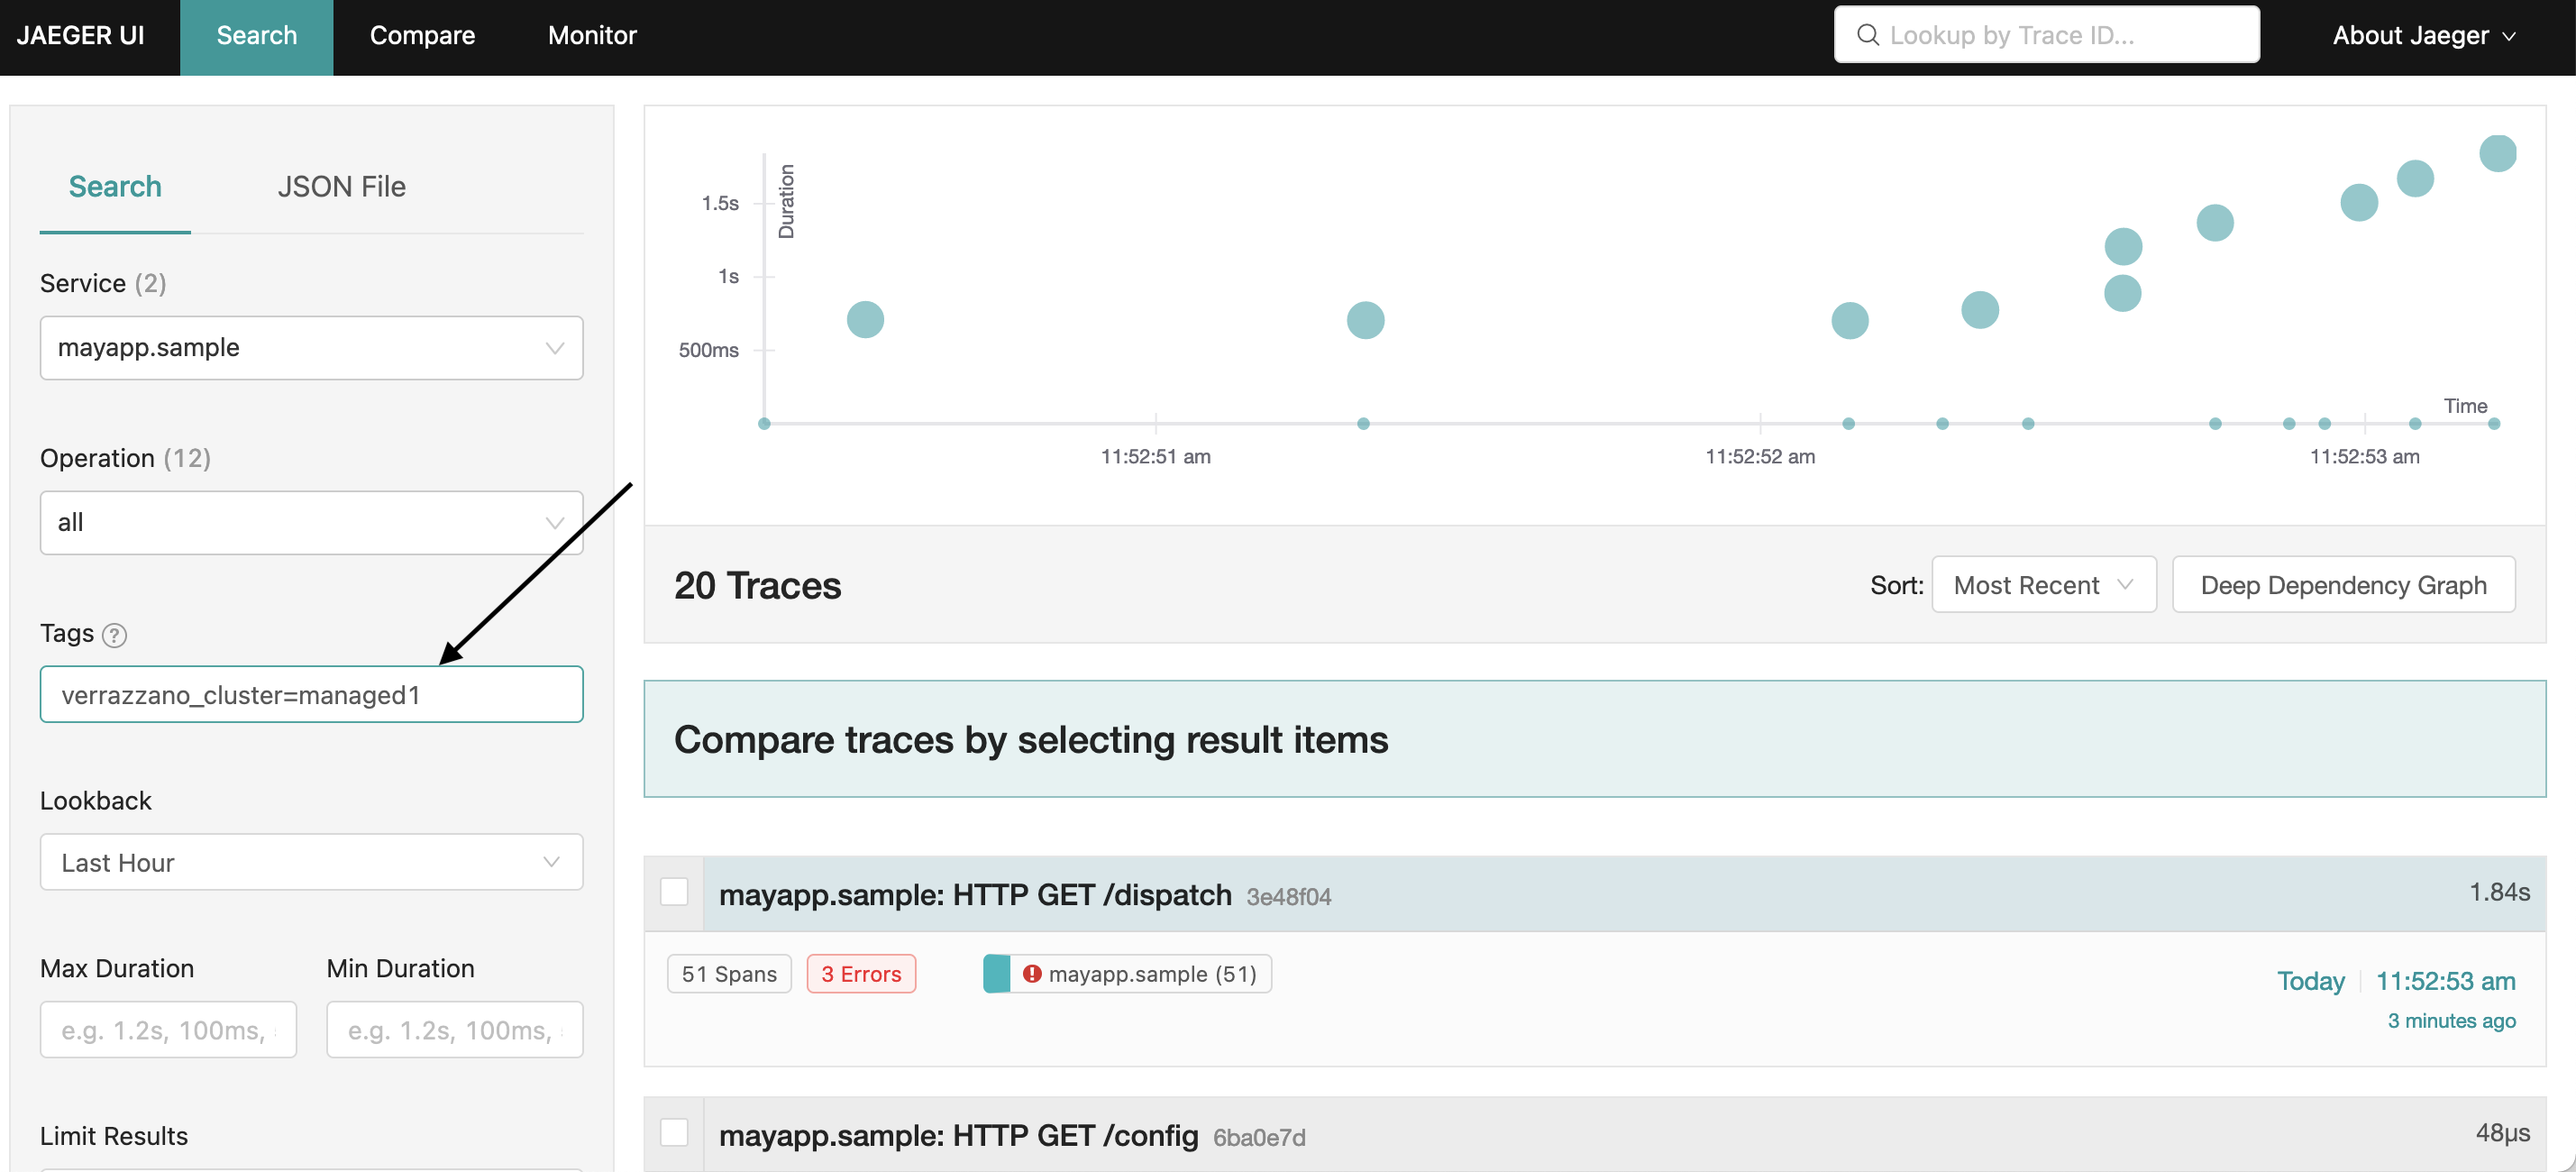
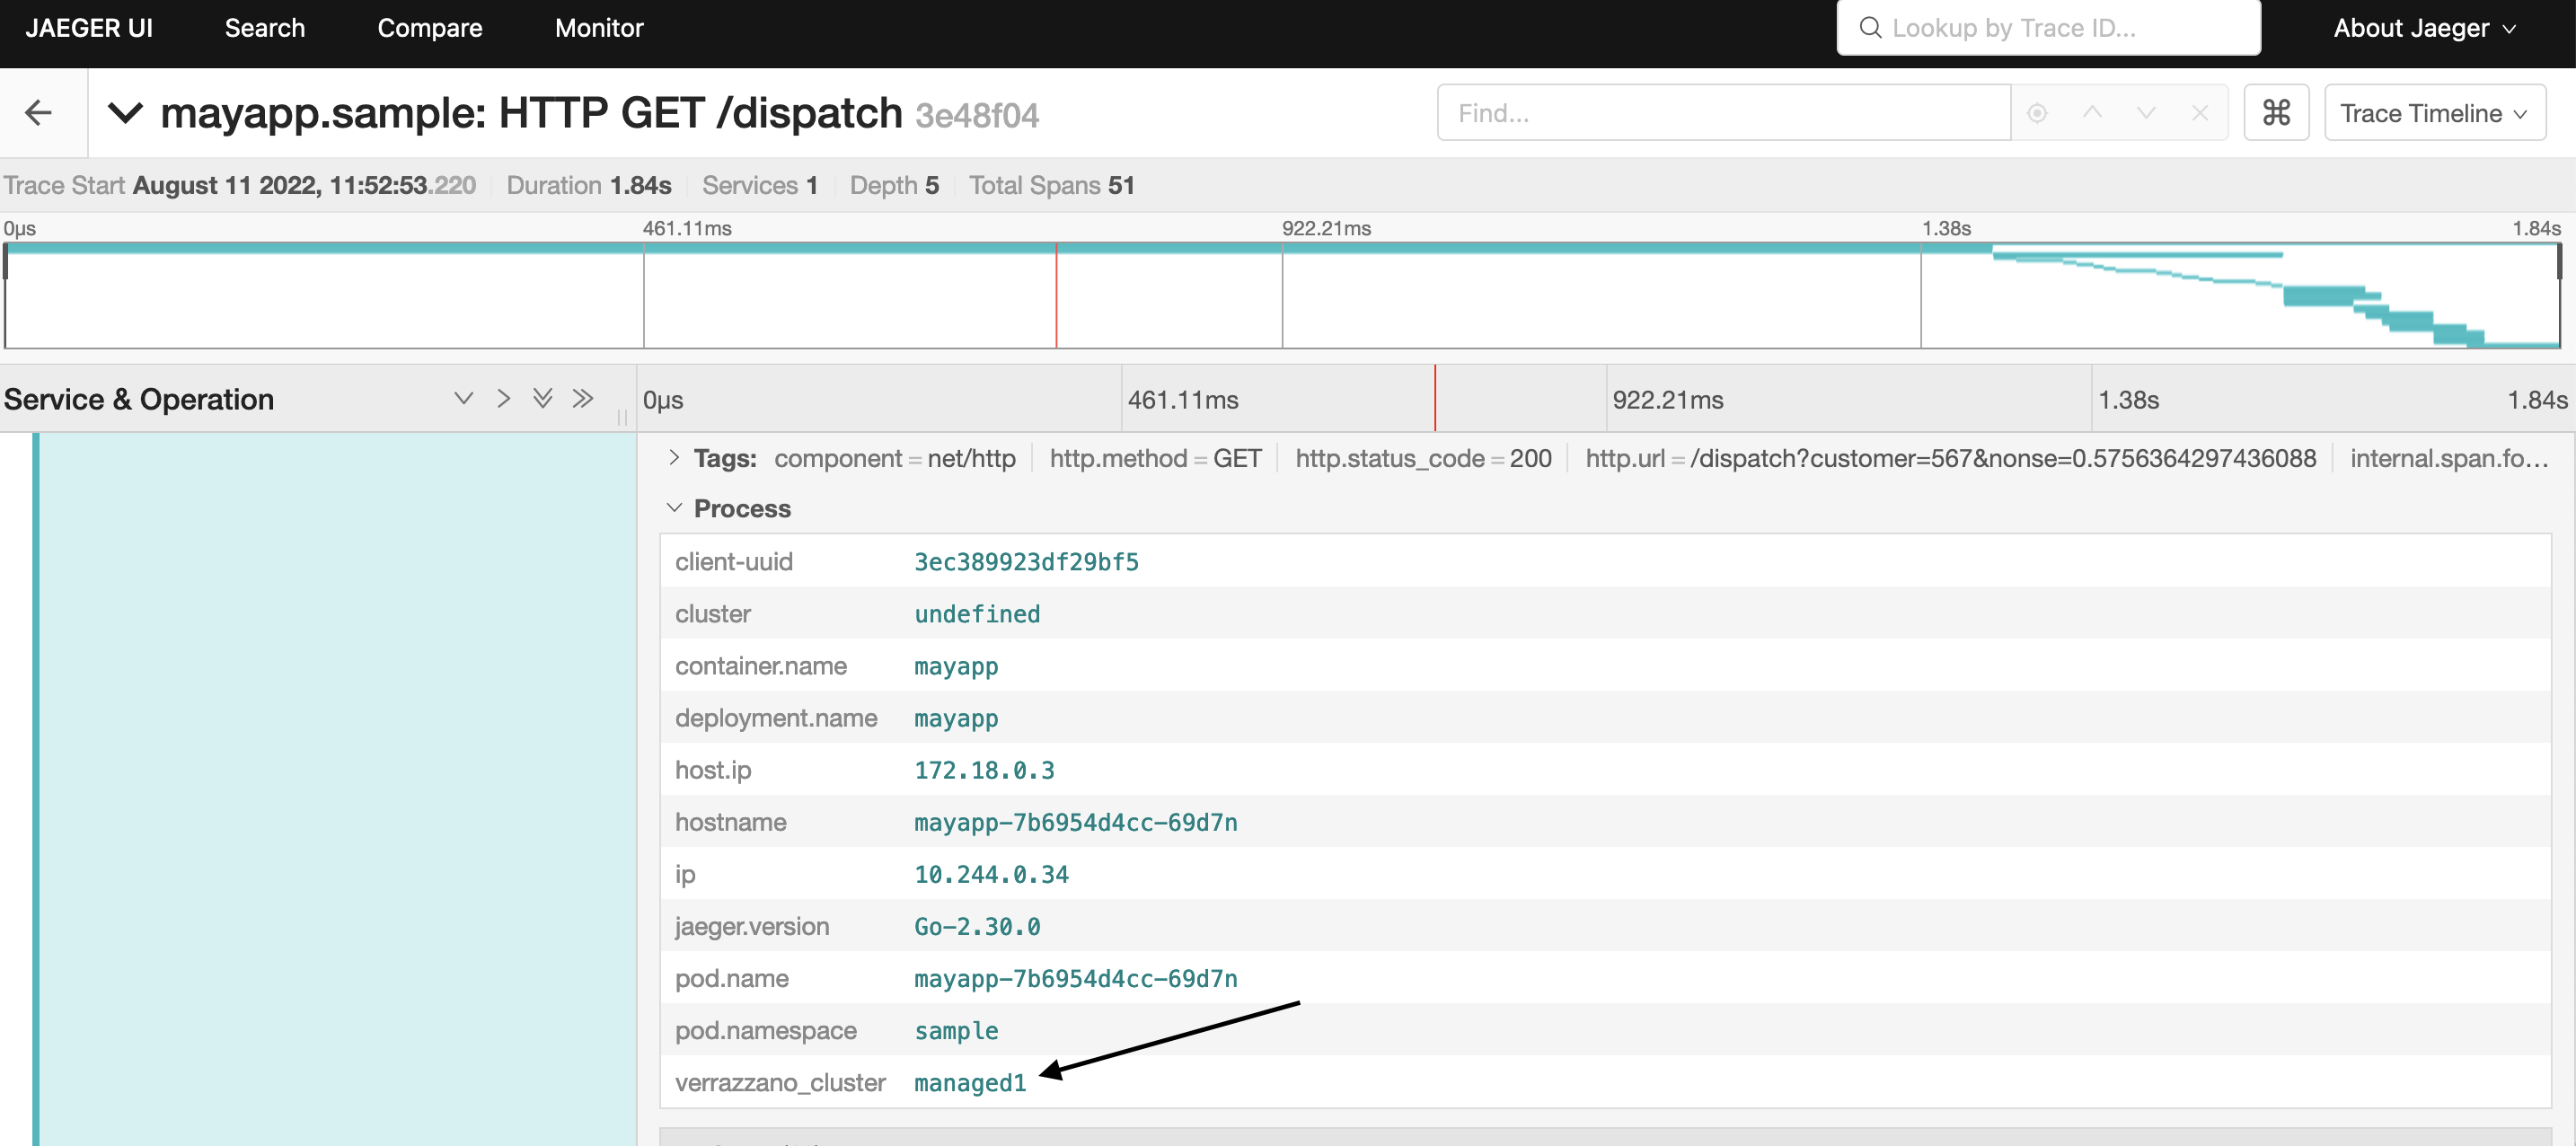
The following spans include the Process tag, verrazzano_cluster, which has the name of the managed cluster. To see the traces
for the managed cluster only, search based on the tag verrazzano_cluster=<managed cluster name>.
Sample output of Jager console screens
Output filtered for the managed cluster, managed1 (arrow).
The span details for managed1.
Store traces and log records
In Verrazzano, all the Jaeger traces are stored in OpenSearch; OpenSearch must be enabled in Verrazzano for this to work. The logs are also captured and stored in OpenSearch; this is done by Fluentd.
Read the blog, Jaeger, Fluentd, and OpenSearch with Verrazzano for a detailed look at how Verrazzano components work together to provide a complete observability stack.
Feedback
Was this page helpful?
Glad to hear it! Please tell us how we can improve.
Sorry to hear that. Please tell us how we can improve.