Install Multicluster Verrazzano
Prerequisites
Before you begin, read this document, Verrazzano in a multicluster environment.
Overview
To set up a multicluster Verrazzano environment, you will need two or more Kubernetes clusters. One of these clusters will the admin cluster; the others will be managed clusters.
The instructions assume an admin cluster and a single managed cluster. For each additional managed cluster, simply repeat the managed cluster instructions.
Install Verrazzano
Install Verrazzano on each Kubernetes cluster.
- On one cluster, install Verrazzano using the
devorprodprofile; this will be the admin cluster. - On the other cluster, install Verrazzano using the
managed-clusterprofile; this will be a managed cluster. Themanaged-clusterprofile contains only the components that are required for a managed cluster. - Create the environment variables,
KUBECONFIG_ADMIN,KUBECONTEXT_ADMIN,KUBECONFIG_MANAGED1, andKUBECONTEXT_MANAGED1, and point them to the kubeconfig files and contexts for the admin and managed cluster, respectively. You will use these environment variables in subsequent steps when registering the managed cluster. The following shows an example of how to set these environment variables.$ export KUBECONFIG_ADMIN=/path/to/your/adminclusterkubeconfig $ export KUBECONFIG_MANAGED1=/path/to/your/managedclusterkubeconfig # Lists the contexts in each kubeconfig file $ kubectl --kubeconfig $KUBECONFIG_ADMIN config get-contexts -o=name my-admin-cluster-context some-other-cluster-context $ kubectl --kubeconfig $KUBECONFIG_MANAGED1 config get-contexts -o=name my-managed-cluster-context some-other-cluster2-context # Choose the right context name for your admin and managed clusters from the output shown and set the KUBECONTEXT # environment variables $ export KUBECONTEXT_ADMIN=<admin-cluster-context-name> $ export KUBECONTEXT_MANAGED1=<managed-cluster-context-name>
For detailed instructions on how to install and customize Verrazzano on a Kubernetes cluster using a specific profile, see the Installation Guide and Installation Profiles.
Register the managed cluster with the admin cluster
The following sections show you how to register the managed cluster with the admin cluster. As indicated, some of these steps are performed on the admin cluster and some on the managed cluster. The commands provided use the environment variables set previously to connect to the appropriate cluster.
Preregistration setup
Before registering the managed cluster, first you’ll need to set up the following items.
- A Secret containing the managed cluster’s CA certificate. Note that the
cacrtfield in this secret can be empty only if the managed cluster uses a well-known CA. This CA certificate is used by the admin cluster to scrape metrics from the managed cluster, for both applications and Verrazzano components. - A ConfigMap containing the externally reachable address of the admin cluster. This will be provided to the managed cluster during registration so that it can connect to the admin cluster.
Follow these preregistration setup steps.
-
If needed for the admin cluster, obtain the managed cluster’s CA certificate. The admin cluster scrapes metrics from the managed cluster’s Prometheus endpoint. If the managed cluster Verrazzano installation uses self-signed certificates or LetsEncrypt staging certificates, then the admin cluster will need the managed cluster’s CA certificate to make an
httpsconnection.-
Depending on whether the Verrazzano installation on the managed cluster uses self-signed certificates, LetsEncrypt staging certificates, or certificates signed by a well-known certificate authority, choose the appropriate instructions:
-
If you are unsure what type of certificates are used, use the following instructions.
-
To check if the
verrazzanoresource is configured to use LetsEncrypt staging certificates:# On the managed cluster $ kubectl --kubeconfig $KUBECONFIG_MANAGED1 --context $KUBECONTEXT_MANAGED1 \ describe verrazzanoIf the output contains the following information, then LetsEncrypt staging certificates are being used.
Cert Manager: Certificate: Acme: Environment: staging Provider: letsEncrypt -
To check the
ca.crtfield of theverrazzano-tlssecret in theverrazzano-systemnamespace on the managed cluster:# On the managed cluster $ kubectl --kubeconfig $KUBECONFIG_MANAGED1 --context $KUBECONTEXT_MANAGED1 \ -n verrazzano-system get secret verrazzano-tls -o jsonpath='{.data.ca\.crt}'If this value is empty, then your managed cluster is using certificates signed by a well-known certificate authority. Otherwise, your managed cluster is using self-signed certificates.
Well-known CA
In this case, no additional configuration is necessary.
Self-signed certificates
If the managed cluster certificates are self-signed, create a file called
managed1.yamlcontaining the CA certificate of the managed cluster as the value of thecacrtfield. In the following commands, the managed cluster’s CA certificate is saved in an environment variable calledMGD_CA_CERT. Then use the--dry-runoption of thekubectlcommand to generate themanaged1.yamlfile.# On the managed cluster $ export MGD_CA_CERT=$(kubectl --kubeconfig $KUBECONFIG_MANAGED1 --context $KUBECONTEXT_MANAGED1 \ get secret verrazzano-tls \ -n verrazzano-system \ -o jsonpath="{.data.ca\.crt}" | base64 --decode) $ kubectl --kubeconfig $KUBECONFIG_MANAGED1 --context $KUBECONTEXT_MANAGED1 \ create secret generic "ca-secret-managed1" \ -n verrazzano-mc \ --from-literal=cacrt="$MGD_CA_CERT" \ --dry-run=client \ -o yaml > managed1.yamlCreate a Secret on the admin cluster that contains the CA certificate for the managed cluster. This secret will be used for scraping metrics from the managed cluster. The
managed1.yamlfile that was created in the previous step provides input to this step.# On the admin cluster $ kubectl --kubeconfig $KUBECONFIG_ADMIN --context $KUBECONTEXT_ADMIN \ apply -f managed1.yaml # After the command succeeds, you may delete the managed1.yaml file $ rm managed1.yamlLetsEncrypt staging certificates
If the managed cluster certificates are LetsEncrypt staging, then create a file called
managed1.yamlcontaining the CA certificate of the managed cluster as the value of thecacrtfield. In the following commands, the managed cluster’s CA certificate is saved in an environment variable calledMGD_CA_CERT. Then use the--dry-runoption of thekubectlcommand to generate themanaged1.yamlfile.# On the managed cluster $ export MGD_CA_CERT=$(kubectl --kubeconfig $KUBECONFIG_MANAGED1 --context $KUBECONTEXT_MANAGED1 \ get secret tls-ca-additional \ -n cattle-system \ -o jsonpath="{.data.ca-additional\.pem}" | base64 --decode) $ kubectl --kubeconfig $KUBECONFIG_MANAGED1 --context $KUBECONTEXT_MANAGED1 \ create secret generic "ca-secret-managed1" \ -n verrazzano-mc \ --from-literal=cacrt="$MGD_CA_CERT" \ --dry-run=client \ -o yaml > managed1.yamlCreate a Secret on the admin cluster that contains the CA certificate for the managed cluster. This secret will be used for scraping metrics from the managed cluster. The
managed1.yamlfile that was created in the previous step provides input to this step.# On the admin cluster $ kubectl --kubeconfig $KUBECONFIG_ADMIN --context $KUBECONTEXT_ADMIN \ apply -f managed1.yaml # After the command succeeds, you may delete the managed1.yaml file $ rm managed1.yaml
-
-
-
Use the following instructions to obtain the Kubernetes API server address for the admin cluster. This address must be accessible from the managed cluster.
-
Most Kubernetes Clusters
For most types of Kubernetes clusters, except for Kind clusters, you can find the externally accessible API server address of the admin cluster from its kubeconfig file.
# View the information for the admin cluster in your kubeconfig file
$ kubectl --kubeconfig $KUBECONFIG_ADMIN --context $KUBECONTEXT_ADMIN config view --minify

# Sample output
apiVersion: v1
kind: Config
clusters:
- cluster:
  certificate-authority-data: DATA+OMITTED
  server: https://11.22.33.44:6443
  name: my-admin-cluster
contexts:
....
....
In the output of this command, you can find the URL of the admin cluster API server from the
serverentry. Set the value of theADMIN_K8S_SERVER_ADDRESSvariable to this URL.$ export ADMIN_K8S_SERVER_ADDRESS=<the server address from the config output>Kind Clusters
Kind clusters run within a Docker container. If your admin and managed clusters are Kind clusters, the API server address of the admin cluster in its kubeconfig file is usually a local address on the host machine, which will not be accessible from the managed cluster. Use the
kindcommand to obtain the “internal” kubeconfig of the admin cluster, which will contain a server address accessible from other Kind clusters on the same machine, and therefore in the same Docker network.$ kind get kubeconfig --internal --name <your-admin-cluster-name> | grep serverIn the output of this command, you can find the URL of the admin cluster API server from the
serverentry. Set the value of theADMIN_K8S_SERVER_ADDRESSvariable to this URL.$ export ADMIN_K8S_SERVER_ADDRESS=<the server address from the config output>
-
On the admin cluster, create a ConfigMap that contains the externally accessible admin cluster Kubernetes server address found in the previous step.
# On the admin cluster
$ kubectl --kubeconfig $KUBECONFIG_ADMIN --context $KUBECONTEXT_ADMIN \
    apply -f <<EOF -
apiVersion: v1
kind: ConfigMap
metadata:
  name: verrazzano-admin-cluster
  namespace: verrazzano-mc
data:
  server: "${ADMIN_K8S_SERVER_ADDRESS}"
EOF
Registration steps
Perform the first three registration steps on the admin cluster, and the last step, on the managed cluster. The cluster against which to run the command is indicated in each code block.
On the admin cluster
-
To begin the registration process for a managed cluster named
managed1, apply the VerrazzanoManagedCluster object on the admin cluster.# On the admin cluster $ kubectl --kubeconfig $KUBECONFIG_ADMIN --context $KUBECONTEXT_ADMIN \ apply -f <<EOF - apiVersion: clusters.verrazzano.io/v1alpha1 kind: VerrazzanoManagedCluster metadata: name: managed1 namespace: verrazzano-mc spec: description: "Test VerrazzanoManagedCluster object" caSecret: ca-secret-managed1 EOF -
Wait for the VerrazzanoManagedCluster resource to reach the
Readystatus. At that point, it will have generated a YAML file that must be applied on the managed cluster to complete the registration process.# On the admin cluster $ kubectl --kubeconfig $KUBECONFIG_ADMIN --context $KUBECONTEXT_ADMIN \ wait --for=condition=Ready \ vmc managed1 -n verrazzano-mc -
Export the YAML file created to register the managed cluster.
# On the admin cluster
$ kubectl --kubeconfig $KUBECONFIG_ADMIN --context $KUBECONTEXT_ADMIN \
    get secret verrazzano-cluster-managed1-manifest \
    -n verrazzano-mc \
    -o jsonpath={.data.yaml} | base64 --decode > register.yaml
On the managed cluster
Apply the registration file exported in the previous step, on the managed cluster.
# On the managed cluster
$ kubectl --kubeconfig $KUBECONFIG_MANAGED1 --context $KUBECONTEXT_MANAGED1 \
    apply -f register.yaml

# After the command succeeds, you may delete the register.yaml file
$ rm register.yaml
After this step, the managed cluster will begin connecting to the admin cluster periodically. When the managed cluster
connects to the admin cluster, it will update the Status field of the VerrazzanoManagedCluster resource for this
managed cluster, with the following information:
- The timestamp of the most recent connection made from the managed cluster, in the
lastAgentConnectTimestatus field. - The host address of the Prometheus instance running on the managed cluster, in the
prometheusHoststatus field. This is then used by the admin cluster to scrape metrics from the managed cluster. - The API address of the managed cluster, in the
apiUrlstatus field. This is used by the admin cluster’s authentication proxy to route incoming requests for managed cluster information, to the managed cluster’s authentication proxy.
Verify that managed cluster registration has completed
You can perform all the verification steps on the admin cluster.
-
Verify that the managed cluster can connect to the admin cluster. View the status of the
VerrazzanoManagedClusterresource on the admin cluster, and check whether thelastAgentConnectTime,prometheusUrl, andapiUrlfields are populated. This may take up to two minutes after completing the registration steps.# On the admin cluster $ kubectl --kubeconfig $KUBECONFIG_ADMIN --context $KUBECONTEXT_ADMIN \ get vmc managed1 -n verrazzano-mc -o yaml # Sample output showing the status field spec: .... .... status: apiUrl: https://verrazzano.default.172.18.0.211.nip.io conditions: - lastTransitionTime: "2021-07-07T15:49:43Z" message: Ready status: "True" type: Ready lastAgentConnectTime: "2021-07-16T14:47:25Z" prometheusHost: prometheus.vmi.system.default.172.18.0.211.nip.io -
Verify that the managed cluster is successfully registered with Rancher. When you perform the registration steps, Verrazzano also registers the managed cluster with Rancher. View the Rancher UI on the admin cluster. If the registration with Rancher was successful, then your cluster will be listed in Rancher’s list of clusters, and will be in
Activestate. You can find the Rancher UI URL for your cluster by following the instructions for Accessing Verrazzano.
Verify that managed cluster metrics are being collected
Verify that the admin cluster is collecting metrics from the managed cluster. The Prometheus output will include
records that contain the name of the Verrazzano cluster (labeled as verrazzano_cluster).
You can find the Prometheus UI URL for your cluster by following the instructions for Accessing Verrazzano.
Run a query for a metric (for example, node_disk_io_time_seconds_total).
Sample output of a Prometheus query
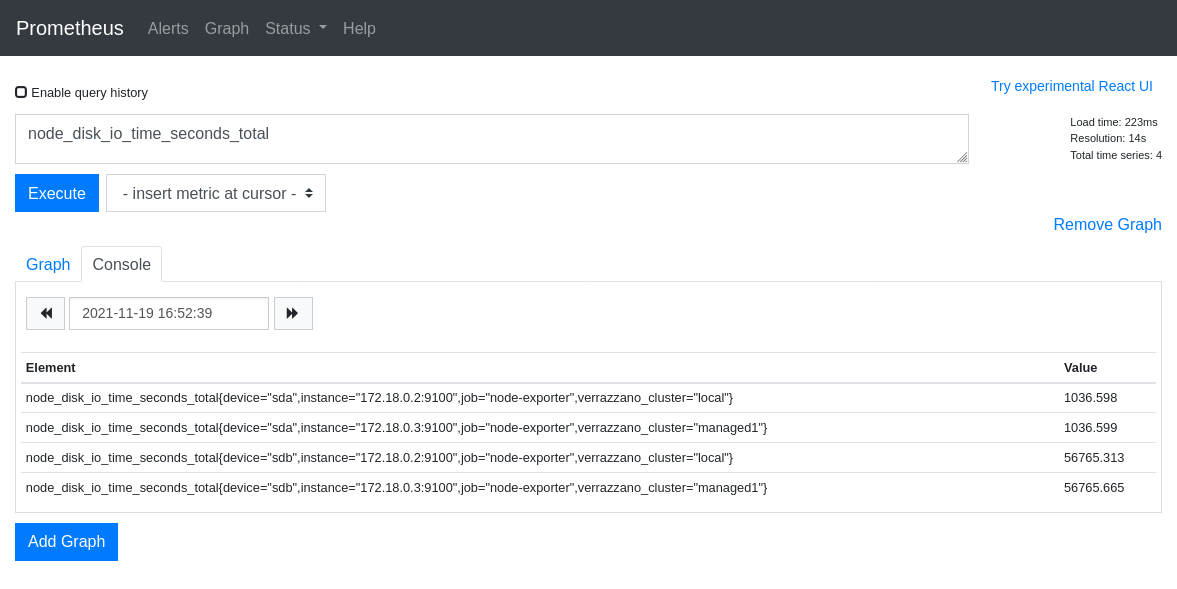
An alternative approach to using the Prometheus UI is to query metrics from the command line. Here is an example of how to obtain Prometheus metrics from the command line. Search the output of the query for responses that have the verrazzano_cluster field set to the name of the managed cluster.
# On the admin cluster
$ prometheusUrl=$(kubectl --kubeconfig $KUBECONFIG_ADMIN --context $KUBECONTEXT_ADMIN \
                 get verrazzano -o jsonpath='{.items[0].status.instance.prometheusUrl}')
$ VZPASS=$(kubectl --kubeconfig $KUBECONFIG_ADMIN --context $KUBECONTEXT_ADMIN \
           get secret verrazzano --namespace verrazzano-system \
           -o jsonpath={.data.password} | base64 --decode; echo)
$ curl -k --user verrazzano:${VZPASS} "${prometheusUrl}/api/v1/query?query=node_disk_io_time_seconds_total"
Verify that managed cluster logs are being collected
Verify that the admin cluster is collecting logs from the managed cluster. The output will include records which have the name of the managed cluster in the cluster_name field.
You can find the OpenSearch Dashboards URL for your cluster by following the instructions for Accessing Verrazzano.
Searching the verrazzano-system data stream for log records with the cluster_name set to the managed cluster name yields logs for the managed cluster.
Sample output of a OpenSearch Dashboards screen
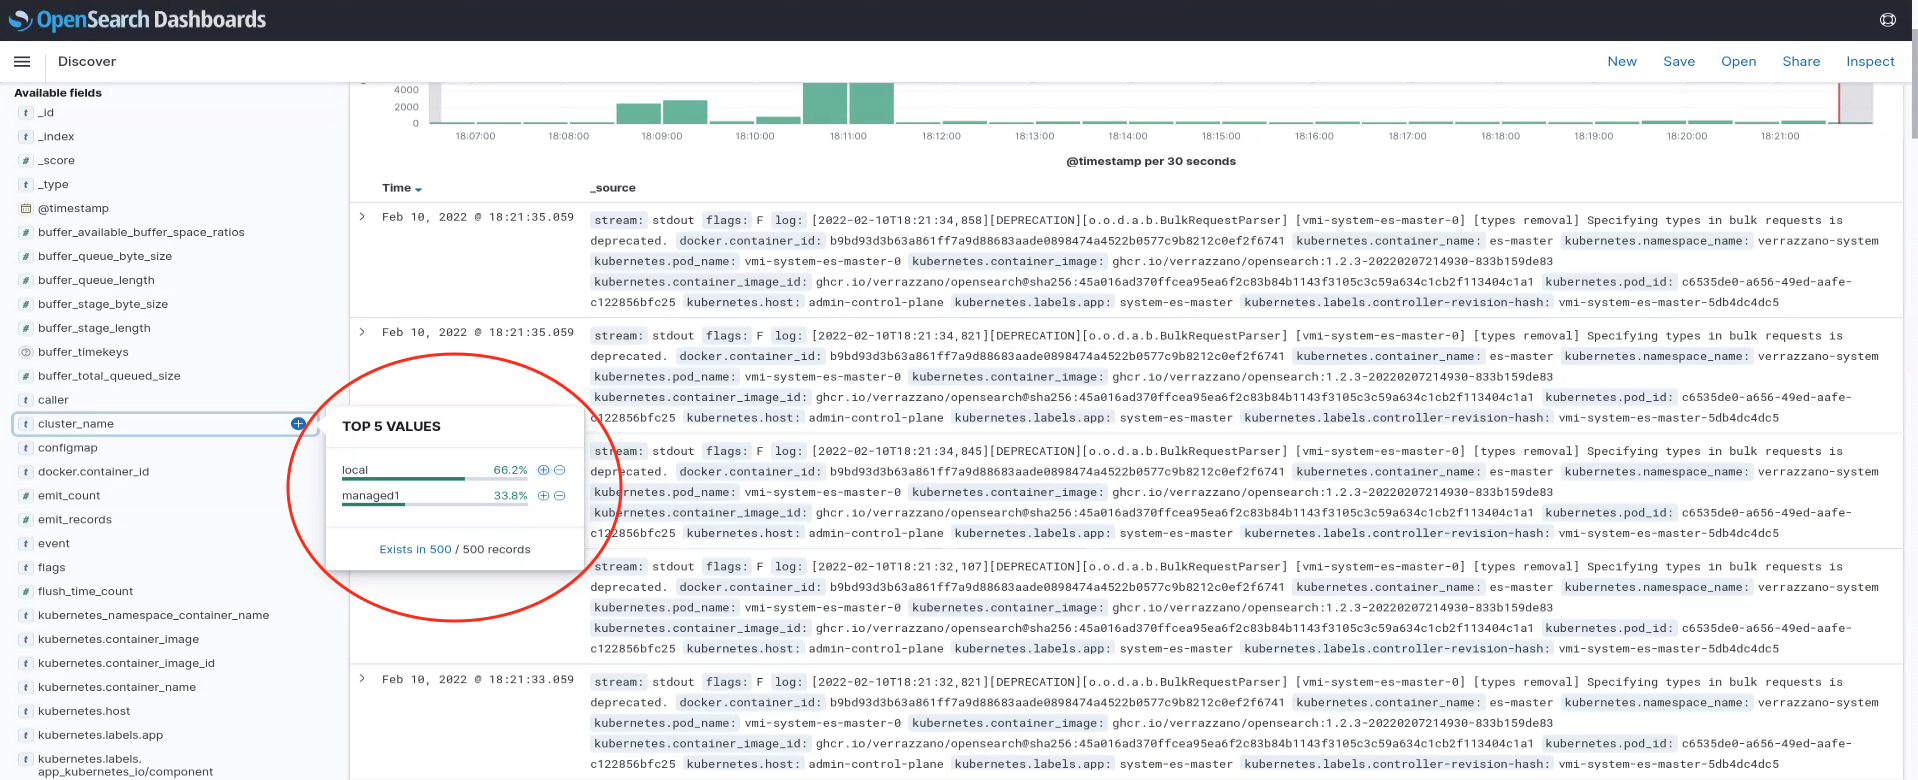
An alternative approach to using the OpenSearch Dashboards is to query OpenSearch from the command line. Here is an example of how to obtain log records from the command line. Search the output of the query for responses that have the cluster_name field set to the name of the managed cluster.
# On the admin cluster
$ OS_URL=$(kubectl --kubeconfig $KUBECONFIG_ADMIN --context $KUBECONTEXT_ADMIN \
                 get verrazzano -o jsonpath='{.items[0].status.instance.openSearchUrl}')
$ VZPASS=$(kubectl --kubeconfig $KUBECONFIG_ADMIN --context $KUBECONTEXT_ADMIN \
           get secret verrazzano --namespace verrazzano-system \
           -o jsonpath={.data.password} | base64 --decode; echo)
$ curl -k --user verrazzano:${VZPASS} -X POST -H 'kbn-xsrf: true' "${OS_URL}/verrazzano-system/_search?size=25"
Run applications in multicluster Verrazzano
The Verrazzano multicluster setup is now complete and you can deploy applications by following the Multicluster Hello World Helidon example application.
Use the admin cluster UI
The admin cluster serves as a central point from which to register and deploy applications to managed clusters.
In the Verrazzano UI on the admin cluster, you can view the following:
- The managed clusters registered with this admin cluster.
- VerrazzanoProjects located on this admin cluster or any of its registered managed clusters, or both.
- Applications located on this admin cluster or any of its registered managed clusters, or both.
Feedback
Was this page helpful?
Glad to hear it! Please tell us how we can improve.
Sorry to hear that. Please tell us how we can improve.