Metrics
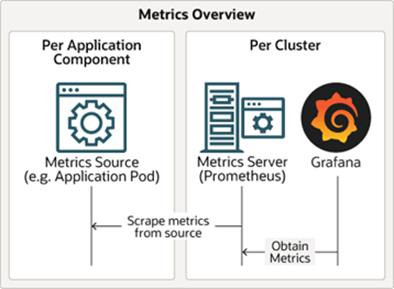
The Verrazzano metrics stack automates metrics aggregation and consists of Prometheus and Grafana components. Metrics sources expose system and application metrics. The Prometheus components retrieve and store the metrics and Grafana provides dashboards to visualize them.
Metrics sources
The following sections describe metrics sources that Verrazzano provides for OAM and standard Kubernetes applications.
OAM
Metrics sources produce metrics and expose them to the Kubernetes Prometheus system using annotations in the pods.
The metrics annotations may differ slightly depending on the resource type.
The following is an example of the WebLogic Prometheus-related configuration specified in the todo-list application pod:
$ kubectl describe pod tododomain-adminserver -n todo-list
Annotations:  prometheus.io/path: /wls-exporter/metrics
              prometheus.io/port: 7001
              prometheus.io/scrape: true
For other resource types, such as Coherence or Helidon, the annotations would look similar to this:
Annotations:  verrazzano.io/metricsEnabled: true
              verrazzano.io/metricsPath: /metrics
              verrazzano.io/metricsPort: 8080
To look directly at the metrics that are being made available by the metric source, map the port and then access the path.
For example, for the previous metric source:
-
Map the port being used to expose the metrics.
$ kubectl port-forward tododomain-adminserver 7001:7001 -n todo-list -
Get the user name and password used to access the metrics source from the corresponding secret.
$ kubectl get secret \ --namespace todo-list tododomain-weblogic-credentials \ -o jsonpath={.data.username} | base64 \ --decode; echo $ kubectl get secret \ --namespace todo-list tododomain-weblogic-credentials \ -o jsonpath={.data.password} | base64 \ --decode; echo -
Access the metrics at the exported path, using the user name and password retrieved in the previous step.
$ curl -u USERNAME:PASSWORD localhost:7001/wls-exporter/metrics
Standard Kubernetes workloads
Verrazzano supports enabling metric sources for Kubernetes workloads deployed without OAM Components. To enable metrics for Kubernetes workloads, you must create a Service Monitor or Pod Monitor, as applicable. For details on Service Monitor and Pod Monitor, refer to the Prometheus Operator documentation.
When creating the Service Monitor or Pod Monitor for your workload, include the label release, with the value
prometheus-operator on the monitor resource.
Verify metrics collection
To verify that the metrics are being collected for your workload, follow these steps.
- Access the Prometheus console.
- From the console, use the navigation bar to access Status/Targets.
- On this page, you will see a target name with this formatting:
<monitor-type>/<workload-namespace>_<workload-name>_<workload-type>, wheremonitor-typemay be serviceMonitor or podMonitor. - Copy this job name from the target labels for use in future queries.
- Verify that the State of this target is
UP. - Next, use the navigation bar to access the Graph.
- Here, use the job name you copied to construct this expression:
{job="<job_name>"} - Use the graph to run this expression and verify that you see application metrics appear.
Metrics Traits use Service Monitors which require Services for metrics collection. If you are unable to verify metrics collection, you might need to manually create a Service for the workload.
For more information on Prometheus solutions, see Troubleshooting Prometheus.
Legacy workloads
Standard Kubernetes workloads that were metrics sources in earlier versions of Verrazzano (1.3.x or earlier), will continue to be supported when upgrading to later versions of Verrazzano.
For workloads that used the legacy default metrics template, Verrazzano will create a Service Monitor in the workload’s namespace to ensure that metrics continue to be scraped. You can make any ongoing changes to the metrics source configuration by editing the Service Monitor.
For workloads that used a legacy custom metrics template, Verrazzano will configure the Prometheus Operator to ensure that metrics continue to be scraped.
Metrics server
- Verrazzano installs the Prometheus Operator in the
verrazzano-monitoringnamespace. - A single Prometheus pod is created by Prometheus Operator in the same namespace.
- Discovers exposed metrics source endpoints.
- Scrapes metrics from metrics sources.
- Responsible for exposing all metrics.
Grafana
Grafana provides visualization for your Prometheus metric data.
- Single pod per cluster.
- Named
vmi-system-grafana-*in theverrazzano-systemnamespace. - Provides dashboards for metrics visualization.
To access Grafana:
-
Get the host name from the Grafana ingress.
$ kubectl get ingress vmi-system-grafana -n verrazzano-system # Sample output NAME CLASS HOSTS ADDRESS PORTS AGE vmi-system-grafana <none> grafana.vmi.system.default.123.456.789.10.nip.io 123.456.789.10 80, 443 26h -
Get the password for the user
verrazzano.$ kubectl get secret \ --namespace verrazzano-system verrazzano \ -o jsonpath={.data.password} | base64 \ --decode; echo -
Access Grafana in a browser using the host name.
-
Log in using the
verrazzanouser and the password.
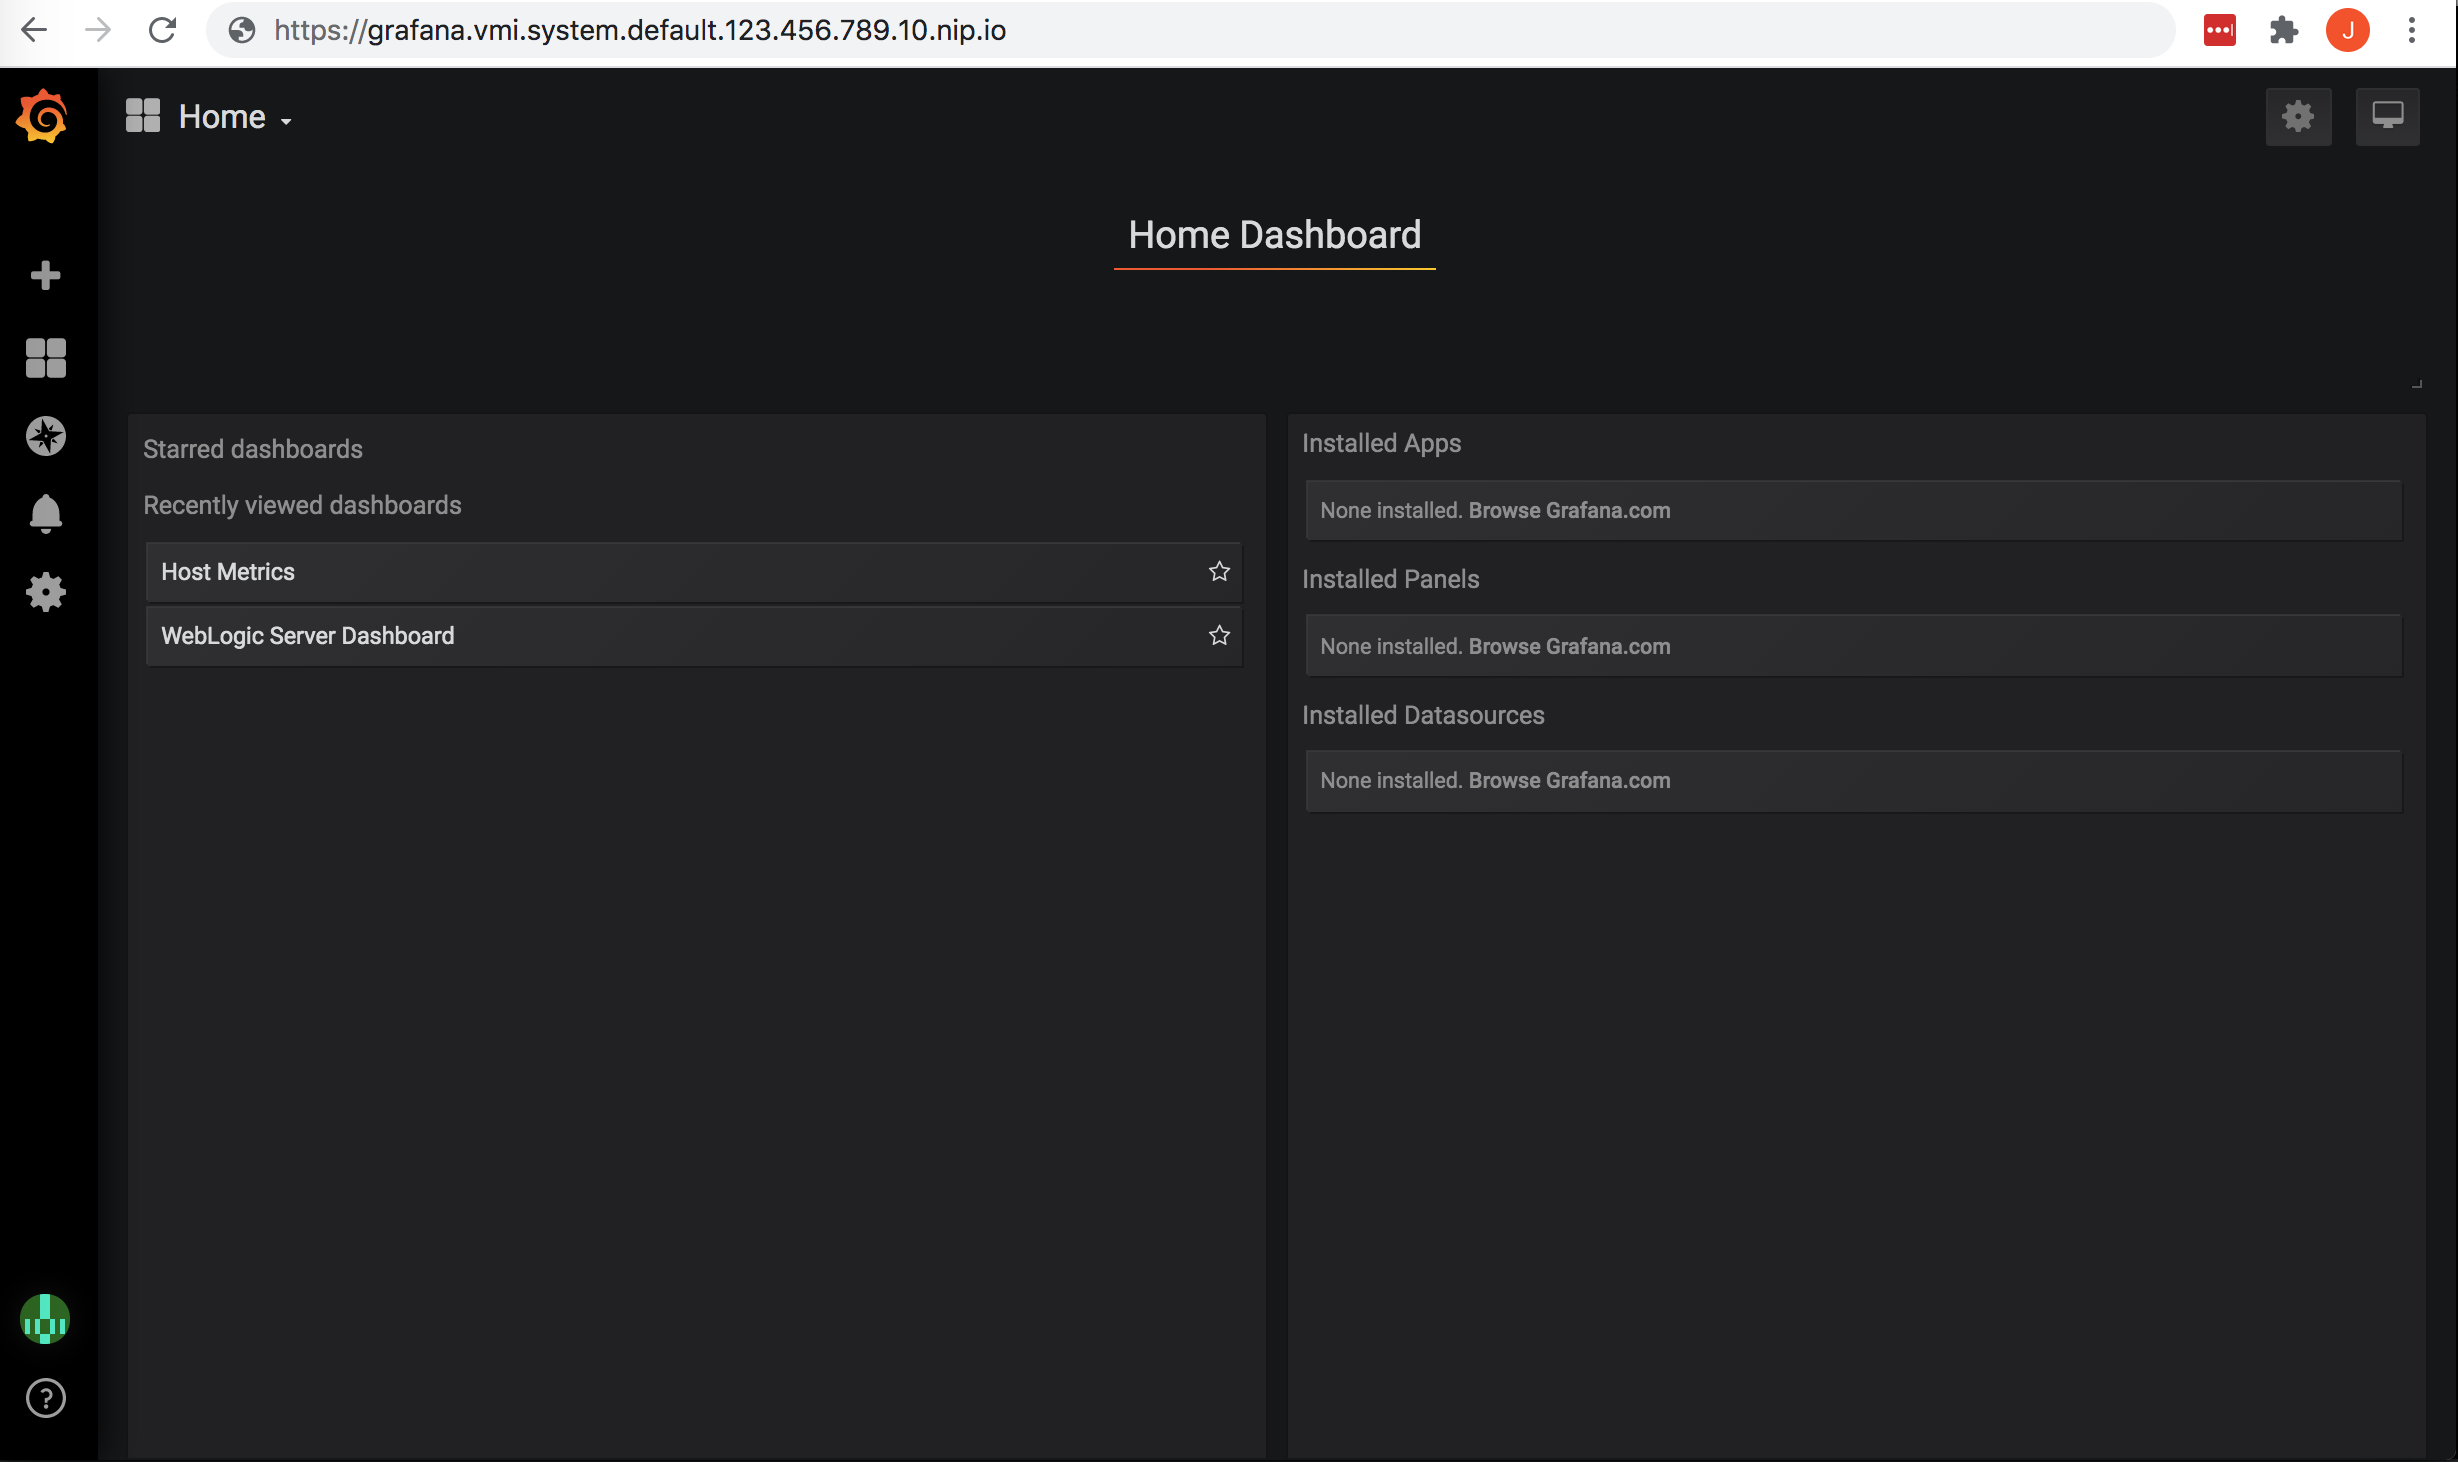
From here, you can select an existing dashboard or create a new dashboard.
To select an existing dashboard, use the drop-down list in the top left corner.
The initial value of this list is Home.
To view host level metrics, select Host Metrics. This will provide system metrics for all
of the nodes in your cluster.
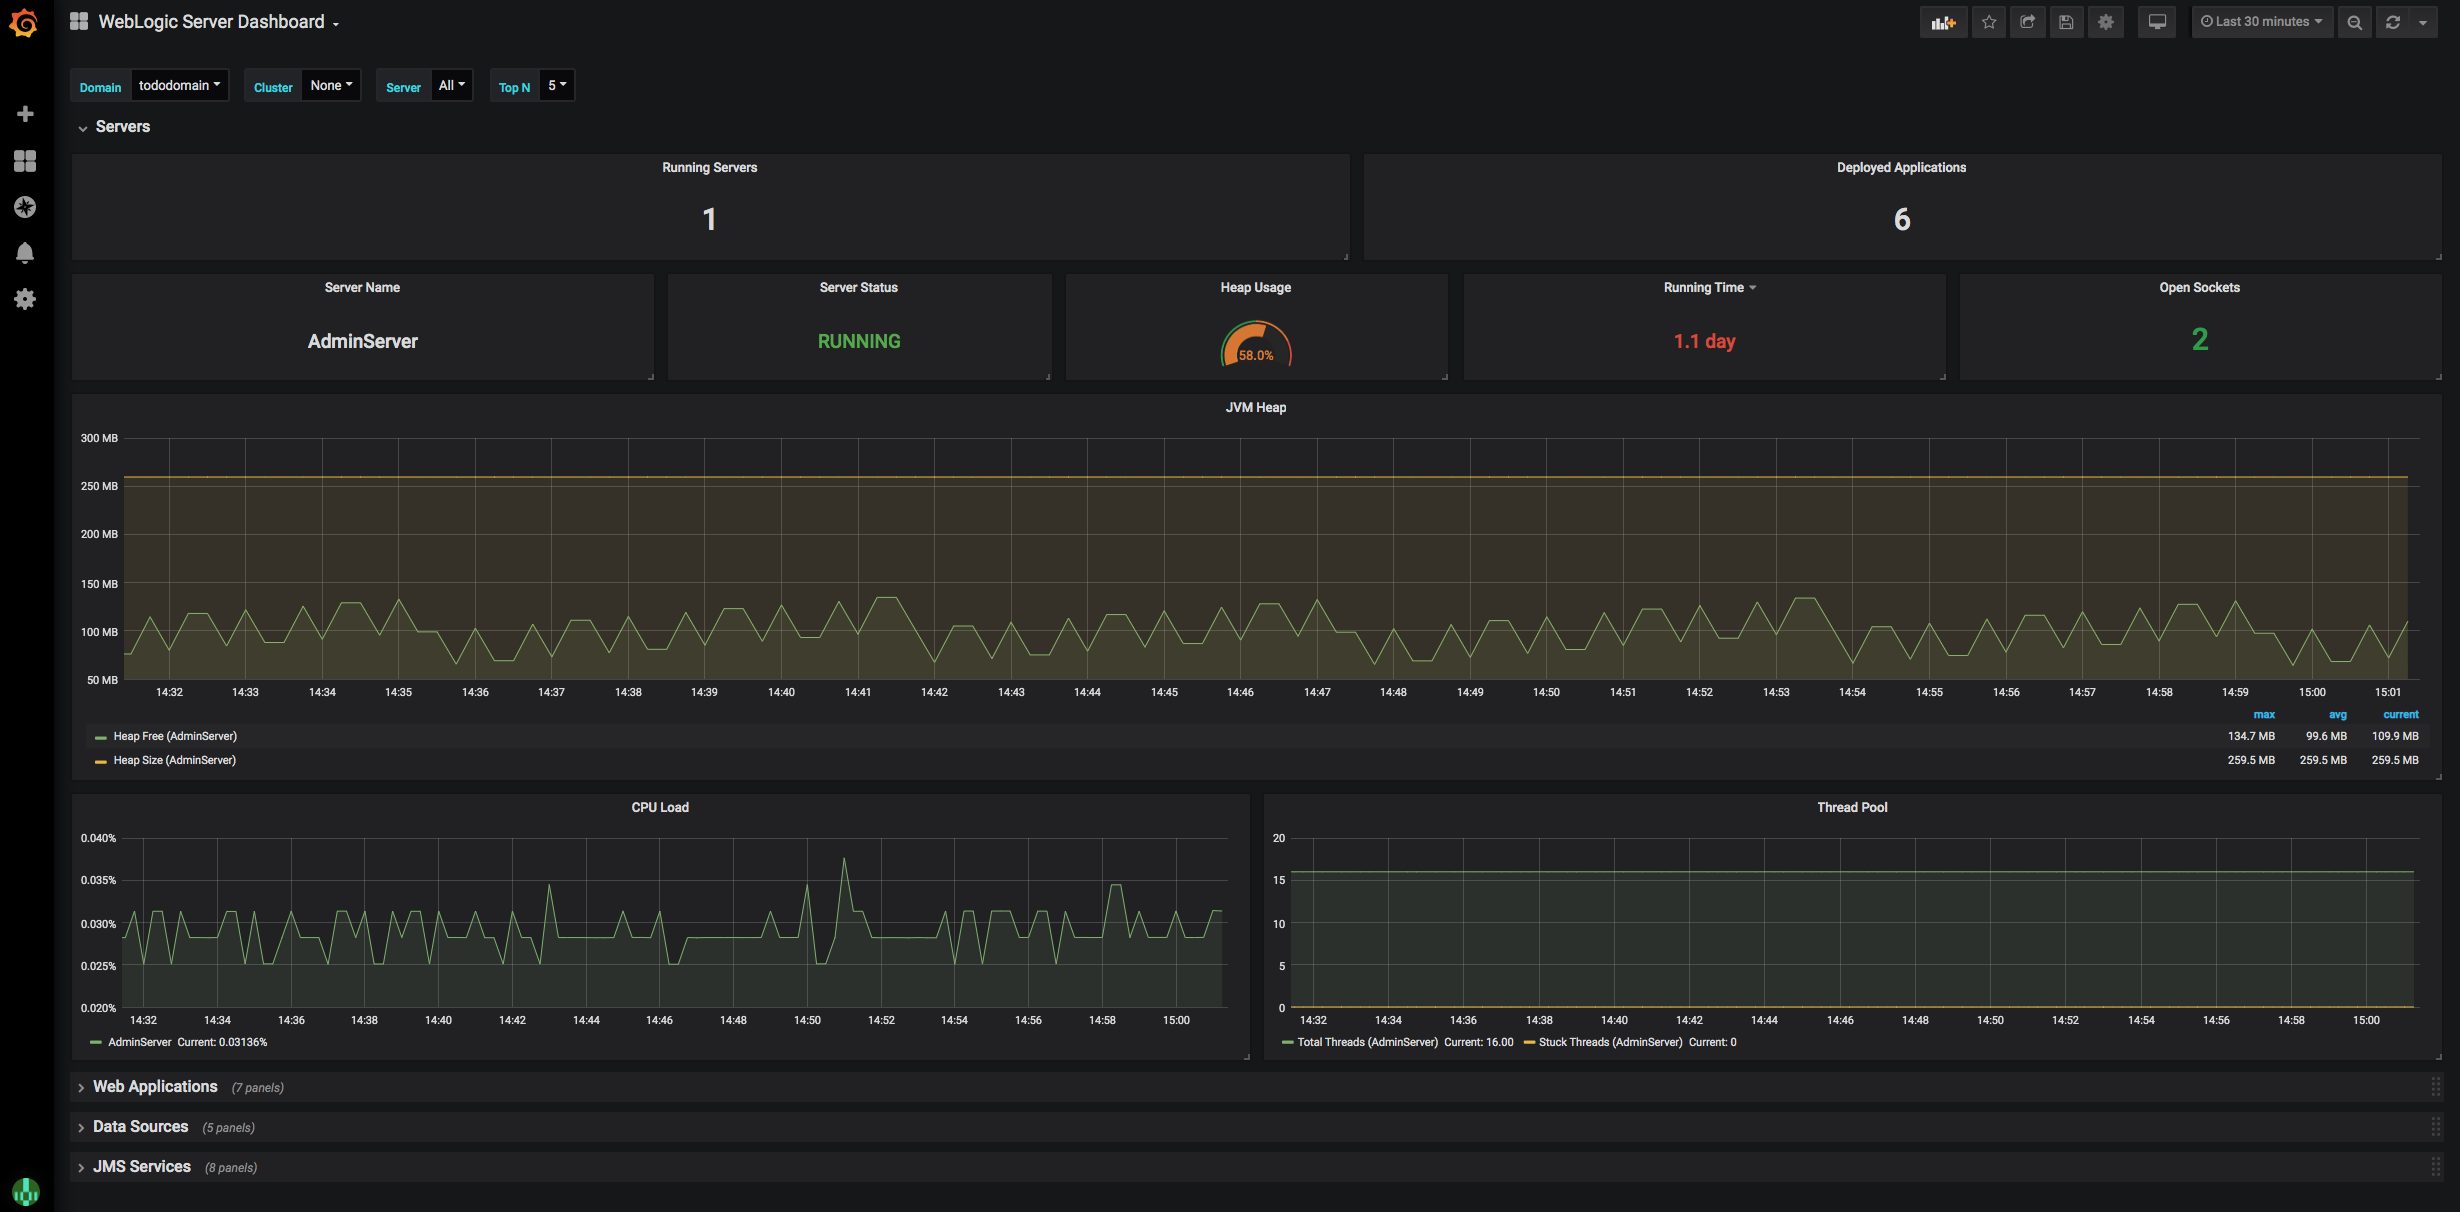
To view the application metrics for the todo-list example application, select WebLogic Server Dashboard
because the todo-list application is a WebLogic application.
Feedback
Was this page helpful?
Glad to hear it! Please tell us how we can improve.
Sorry to hear that. Please tell us how we can improve.