Metrics
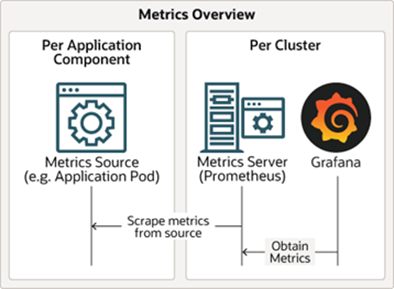
The Verrazzano metrics stack automates metrics aggregation and consists of Prometheus and Grafana components. Metrics sources expose system and application metrics. The Prometheus components retrieve and store the metrics and Grafana provides dashboards to visualize them.
Metrics sources
The following sections describe metrics sources that Verrazzano provides for OAM and standard Kubernetes applications.
OAM
Metrics sources produce metrics and expose them to the Kubernetes Prometheus system using annotations in the pods.
The metrics annotations may differ slightly depending on the resource type.
The following is an example of the WebLogic Prometheus-related configuration specified in the todo-list application pod:
$ kubectl describe pod tododomain-adminserver -n todo-list
Annotations:  prometheus.io/path: /wls-exporter/metrics
              prometheus.io/port: 7001
              prometheus.io/scrape: true
For other resource types, such as Coherence or Helidon, the annotations would look similar to this:
Annotations:  verrazzano.io/metricsEnabled: true
              verrazzano.io/metricsPath: /metrics
              verrazzano.io/metricsPort: 8080
To look directly at the metrics that are being made available by the metric source, map the port and then access the path.
For example, for the previous metric source:
-
Map the port being used to expose the metrics.
$ kubectl port-forward tododomain-adminserver 7001:7001 -n todo-list -
Get the user name and password used to access the metrics source from the corresponding secret.
$ kubectl get secret \ --namespace todo-list tododomain-weblogic-credentials \ -o jsonpath={.data.username} | base64 \ --decode; echo $ kubectl get secret \ --namespace todo-list tododomain-weblogic-credentials \ -o jsonpath={.data.password} | base64 \ --decode; echo -
Access the metrics at the exported path, using the user name and password retrieved in the previous step.
$ curl -u USERNAME:PASSWORD localhost:7001/wls-exporter/metrics
Standard Kubernetes workloads
Verrazzano enables metric sources for Kubernetes workloads deployed without OAM components.
Verrazzano supports the following workload types: Deployments, ReplicaSets, StatefulSets, and Pods.
To enable metrics for Kubernetes workloads, you must label the workload namespace with verrazzano-managed=true.
Metrics Template
A Metrics Template is a custom resource created by Verrazzano to manage metrics configurations for standard Kubernetes workloads.
Metrics templates can be placed in the workload namespace or the verrazzano-system namespace.
By default, Verrazzano installs a metrics template named standard-k8s-metrics-template in the verrazzano-system namespace.
This metrics template handles all the aforementioned workload types.
If the default metrics template does not meet your requirements, then you can create your own metrics templates to extend and alter its functionality.
As outlined in the API, the metrics template contains a workloadSelector field that specifies the resources for which the template applies.
If you want to forgo the workload selection and manually specify a template, you can add the annotation app.verrazzano.io/metrics=<template-name>
to the namespace of the workload or to the workload itself.
Additionally, you can opt out of metrics for your namespace or workload by setting the annotation app.verrazzano.io/metrics=none.
The template matching precedence is as follows:
-
A workload is annotated.
a. A template matching the annotation value is found in the workload namespace.
b. A template matching the annotation value is found in the
verrazzano-systemnamespace.c. No template is found, an error is recorded, and metrics are not processed for this workload.
-
A workload namespace is annotated.
a. A template matching the annotation value is found in the workload namespace.
b. A template matching the annotation value is found in the
verrazzano-systemnamespace.c. No template is found, an error is recorded, and metrics are not processed for this namespace.
-
No annotation is present.
a. A template in the workload namespace matches the workload through the
workloadSelectorfield.b. A template in the
verrazzano-systemnamespace matches the workload through theworkloadSelectorfield.c. No templates match the workload and metrics are not processed for this workload.
If a workload with no annotations matches multiple templates in a namespace, there is no guaranteed precedence in template matching. If this is the case, it is more reliable to specify the template you require by using an annotation.
To verify that the metrics template process was successful, follow these steps:
- Access the Prometheus console.
- From the console, use the navigation bar to access Status/Targets.
- On this page, you will see a target name with this formatting:
<workload-namespace>_<workload-name>_<workload-type>. - Copy this job name for use in future queries.
- Verify that the State of this target is
UP. - Next, use the navigation bar to access the Graph.
- Here, use the job name you copied to construct this expression:
{job="<job_name>"} - Use the graph to run this expression and verify that you see application metrics appear.
Prometheus overrides
The standard-k8s-metrics-template metrics template installed by Verrazzano uses the following pod annotations to populate the Prometheus configuration.
If not specified, Verrazzano will use these default values:
Annotations:  prometheus.io/path: /metrics
              prometheus.io/port: 8080
              prometheus.io/scrape: true
To alter these values, annotate the workload pod with the corresponding annotations. For example, if you want to change the metrics path, then add the following to a Deployment definition:
apiVersion: apps/v1
kind: Deployment
metadata:
  name: hello-helidon-deployment
  namespace: hello-helidon
  annotations:
    app.verrazzano.io/metrics: standard-k8s-metrics-template
spec:
  template:
    metadata:
      # add path annotation to the pod template
      annotations:
        prometheus.io/path: "/custom/metrics/path"
Prometheus configuration
If you want to create your own metrics template, you will need to construct a Prometheus scrape config.
The scrape config uses Go Templates to generate configuration values based on Kubernetes resources.
You can reference values in the workload and namespace definitions for use in the scrape config.
For example, the default scrape config references the workload namespace field through this reference: .workload.metadata.namespace.
Do not include the job_name field in your scrape config as it will be generated by Verrazzano.
For guidance on how to construct a Prometheus scrape config, reference the scrapeConfigTemplate section in the Metrics Template example.
Metrics server
- Single pod per cluster.
- Named
vmi-system-prometheus-*inverrazzano-systemnamespace. - Discovers exposed metrics source endpoints.
- Scrapes metrics from metrics sources.
- Responsible for exposing all metrics.
Grafana
Grafana provides visualization for your Prometheus metric data.
- Single pod per cluster.
- Named
vmi-system-grafana-*inverrazzano-systemnamespace. - Provides dashboards for metrics visualization.
To access Grafana:
-
Get the host name from the Grafana ingress.
$ kubectl get ingress vmi-system-grafana -n verrazzano-system # Sample output NAME CLASS HOSTS ADDRESS PORTS AGE vmi-system-grafana <none> grafana.vmi.system.default.123.456.789.10.nip.io 123.456.789.10 80, 443 26h -
Get the password for the user
verrazzano.$ kubectl get secret \ --namespace verrazzano-system verrazzano \ -o jsonpath={.data.password} | base64 \ --decode; echo -
Access Grafana in a browser using the previous host name.
-
Log in using the
verrazzanouser and the previous password.
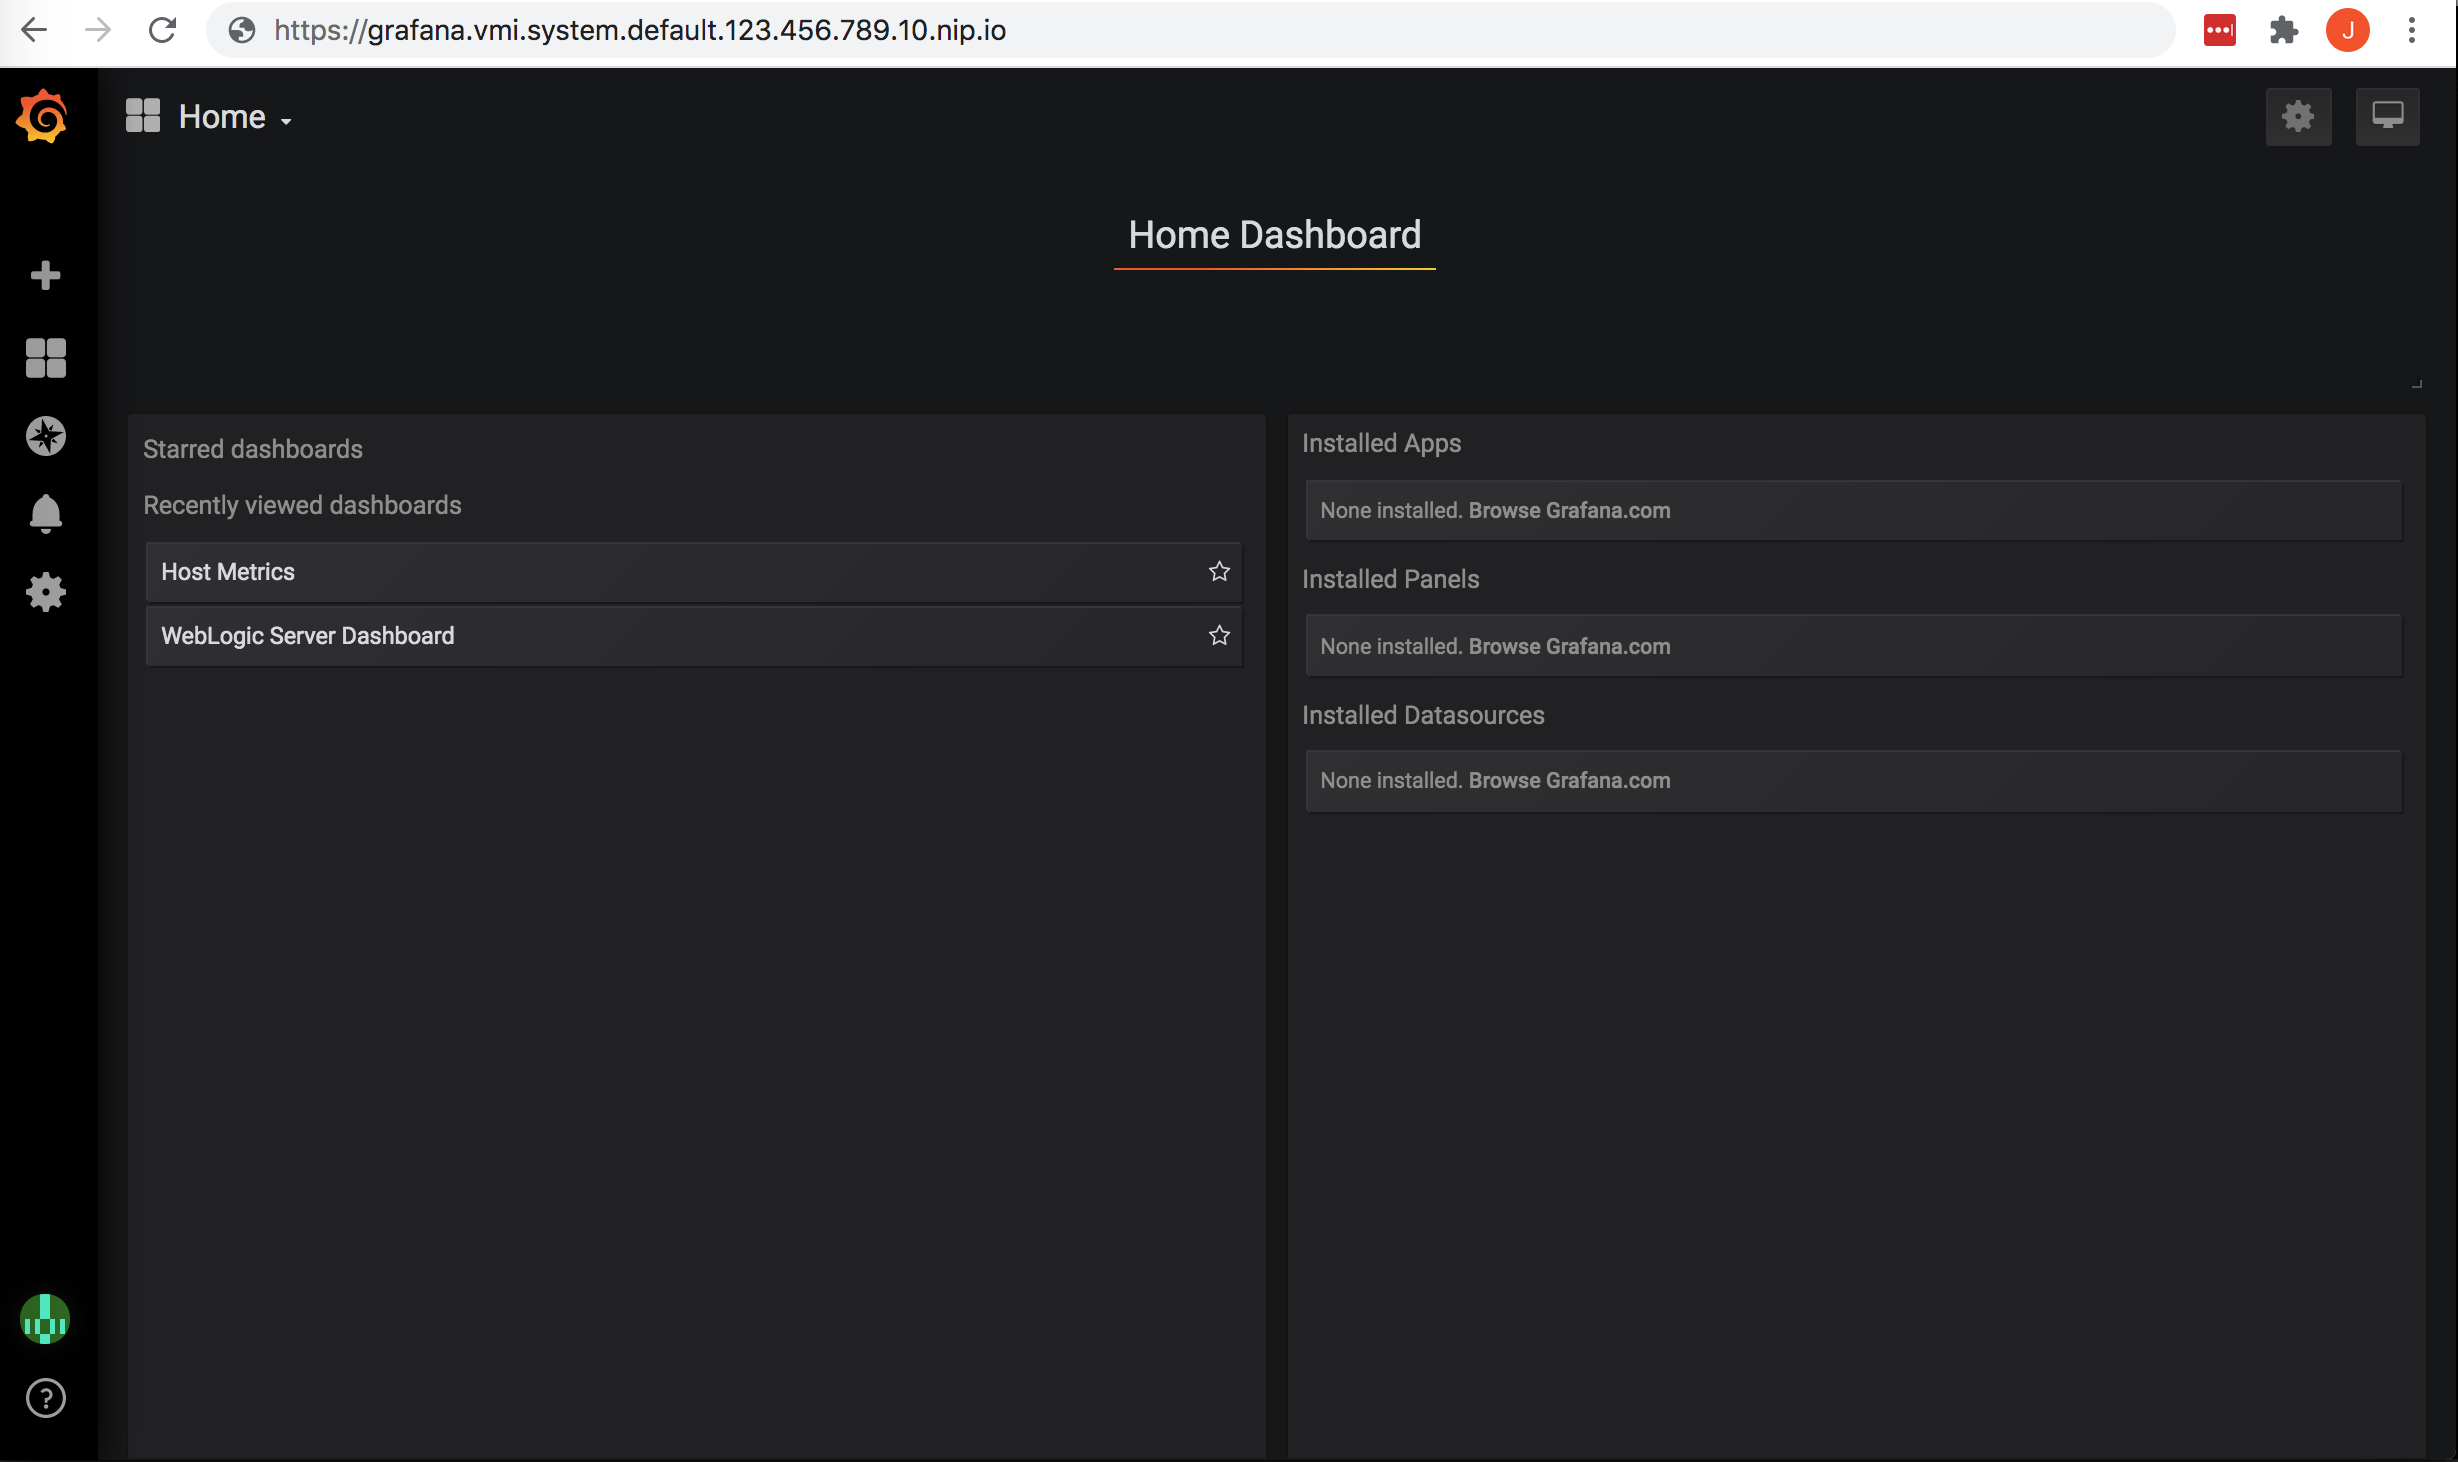
From here, you can select an existing dashboard or create a new dashboard.
To select an existing dashboard, use the drop-down list in the top left corner.
The initial value of this list is Home.
To view host level metrics, select Host Metrics. This will provide system metrics for all
of the nodes in your cluster.
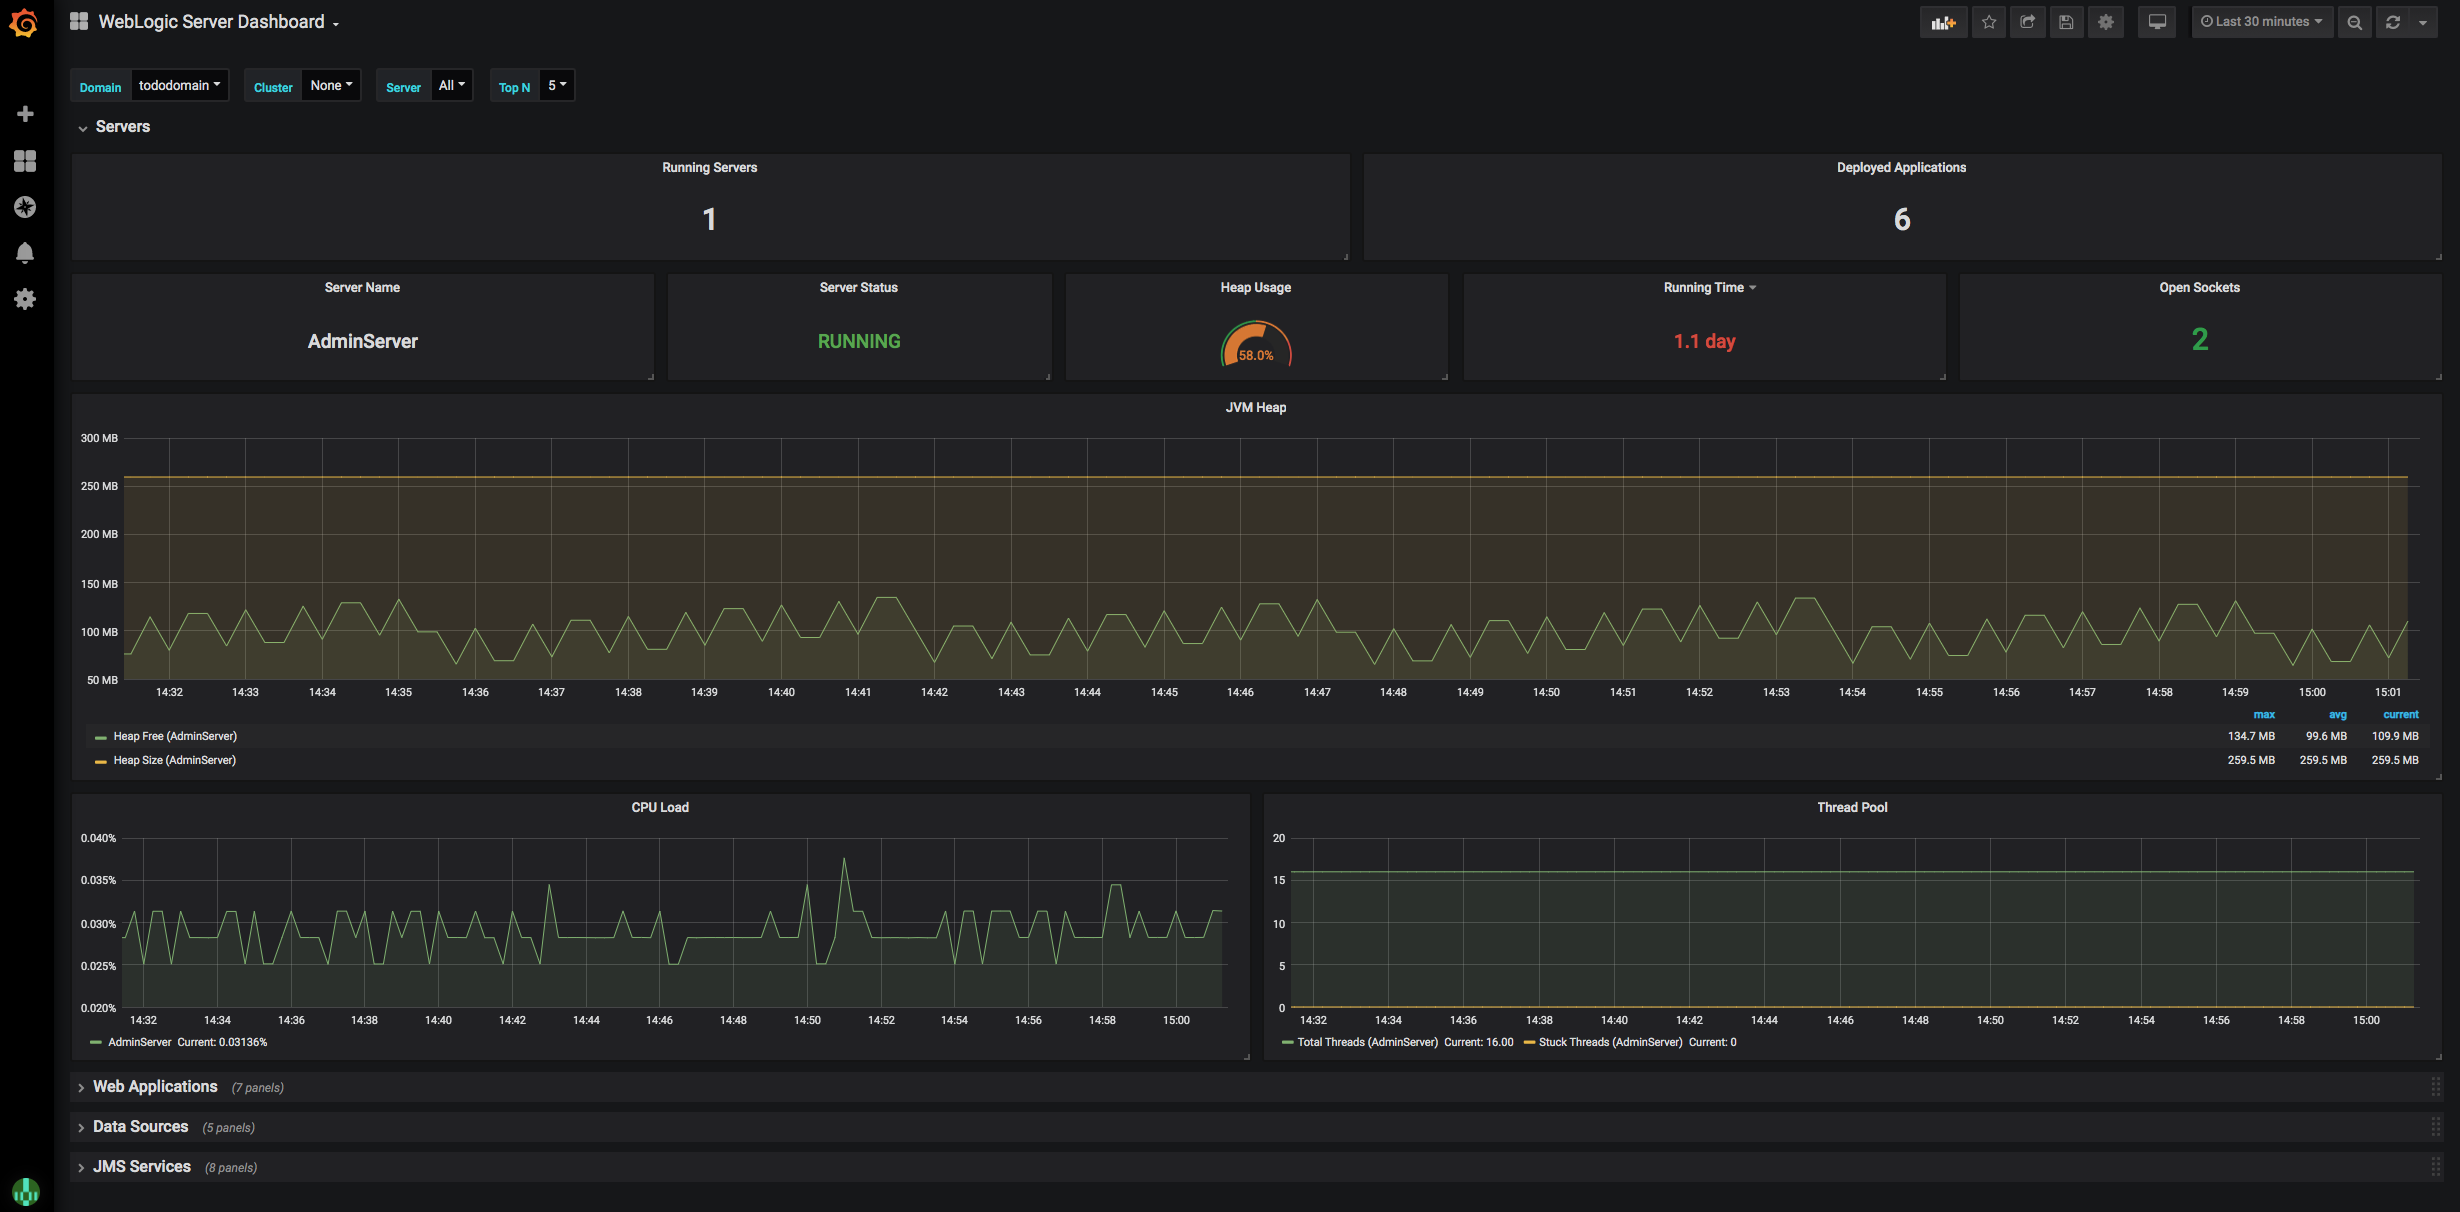
To view the application metrics for the todo-list example application, select WebLogic Server Dashboard
because the todo-list application is a WebLogic application.
Feedback
Was this page helpful?
Glad to hear it! Please tell us how we can improve.
Sorry to hear that. Please tell us how we can improve.