Metrics
The Verrazzano metrics stack automates metrics aggregation and consists of Prometheus and Grafana components. Metrics sources expose system and application metrics. The Prometheus components retrieve and store the metrics and Grafana provides dashboards to visualize them.
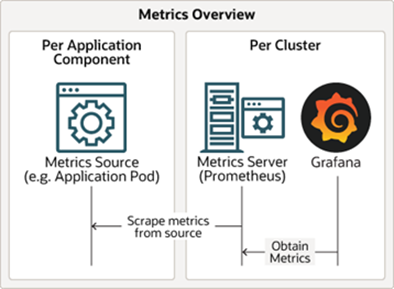
Metrics sources
Metrics sources produce metrics and expose them to the Kubernetes Prometheus system using annotations in the pods.
The metrics annotations may differ slightly depending on the resource type.
The following is an example of the WebLogic Prometheus-related configuration specified in the todo-list application pod:
$ kubectl describe pod tododomain-adminserver -n todo-list
Annotations:  prometheus.io/path: /wls-exporter/metrics
              prometheus.io/port: 7001
              prometheus.io/scrape: true
For other resource types, such as Coherence or Helidon, the annotations would look similar to this:
Annotations:  verrazzano.io/metricsEnabled: true
              verrazzano.io/metricsPath: /metrics
              verrazzano.io/metricsPort: 8080
To look directly at the metrics that are being made available by the metric source, map the port and then access the path.
For example, for the previous metric source:
-
Map the port being used to expose the metrics.
$ kubectl port-forward tododomain-adminserver 7001:7001 -n todo-list -
Get the user name and password used to access the metrics source from the corresponding secret.
$ kubectl get secret \ --namespace todo-list tododomain-weblogic-credentials \ -o jsonpath={.data.username} | base64 \ --decode; echo $ kubectl get secret \ --namespace todo-list tododomain-weblogic-credentials \ -o jsonpath={.data.password} | base64 \ --decode; echo -
Access the metrics at the exported path, using the user name and password retrieved in the previous step.
$ curl -u USERNAME:PASSWORD localhost:7001/wls-exporter/metrics
Metrics server
- Single pod per cluster.
- Named
vmi-system-prometheus-*inverrazzano-systemnamespace. - Discovers exposed metrics source endpoints.
- Scrapes metrics from metrics sources.
- Responsible for exposing all metrics.
Grafana
Grafana provides visualization for your Prometheus metric data.
- Single pod per cluster.
- Named
vmi-system-grafana-*inverrazzano-systemnamespace. - Provides dashboards for metrics visualization.
To access Grafana:
-
Get the hostname from the Grafana ingress.
$ kubectl get ingress vmi-system-grafana -n verrazzano-system # Sample output NAME CLASS HOSTS ADDRESS PORTS AGE vmi-system-grafana <none> grafana.vmi.system.default.123.456.789.10.nip.io 123.456.789.10 80, 443 26h -
Get the password for the user
verrazzano.$ kubectl get secret \ --namespace verrazzano-system verrazzano \ -o jsonpath={.data.password} | base64 \ --decode; echo -
Access Grafana in a browser using the previous hostname.
-
Log in using the
verrazzanouser and the previous password.
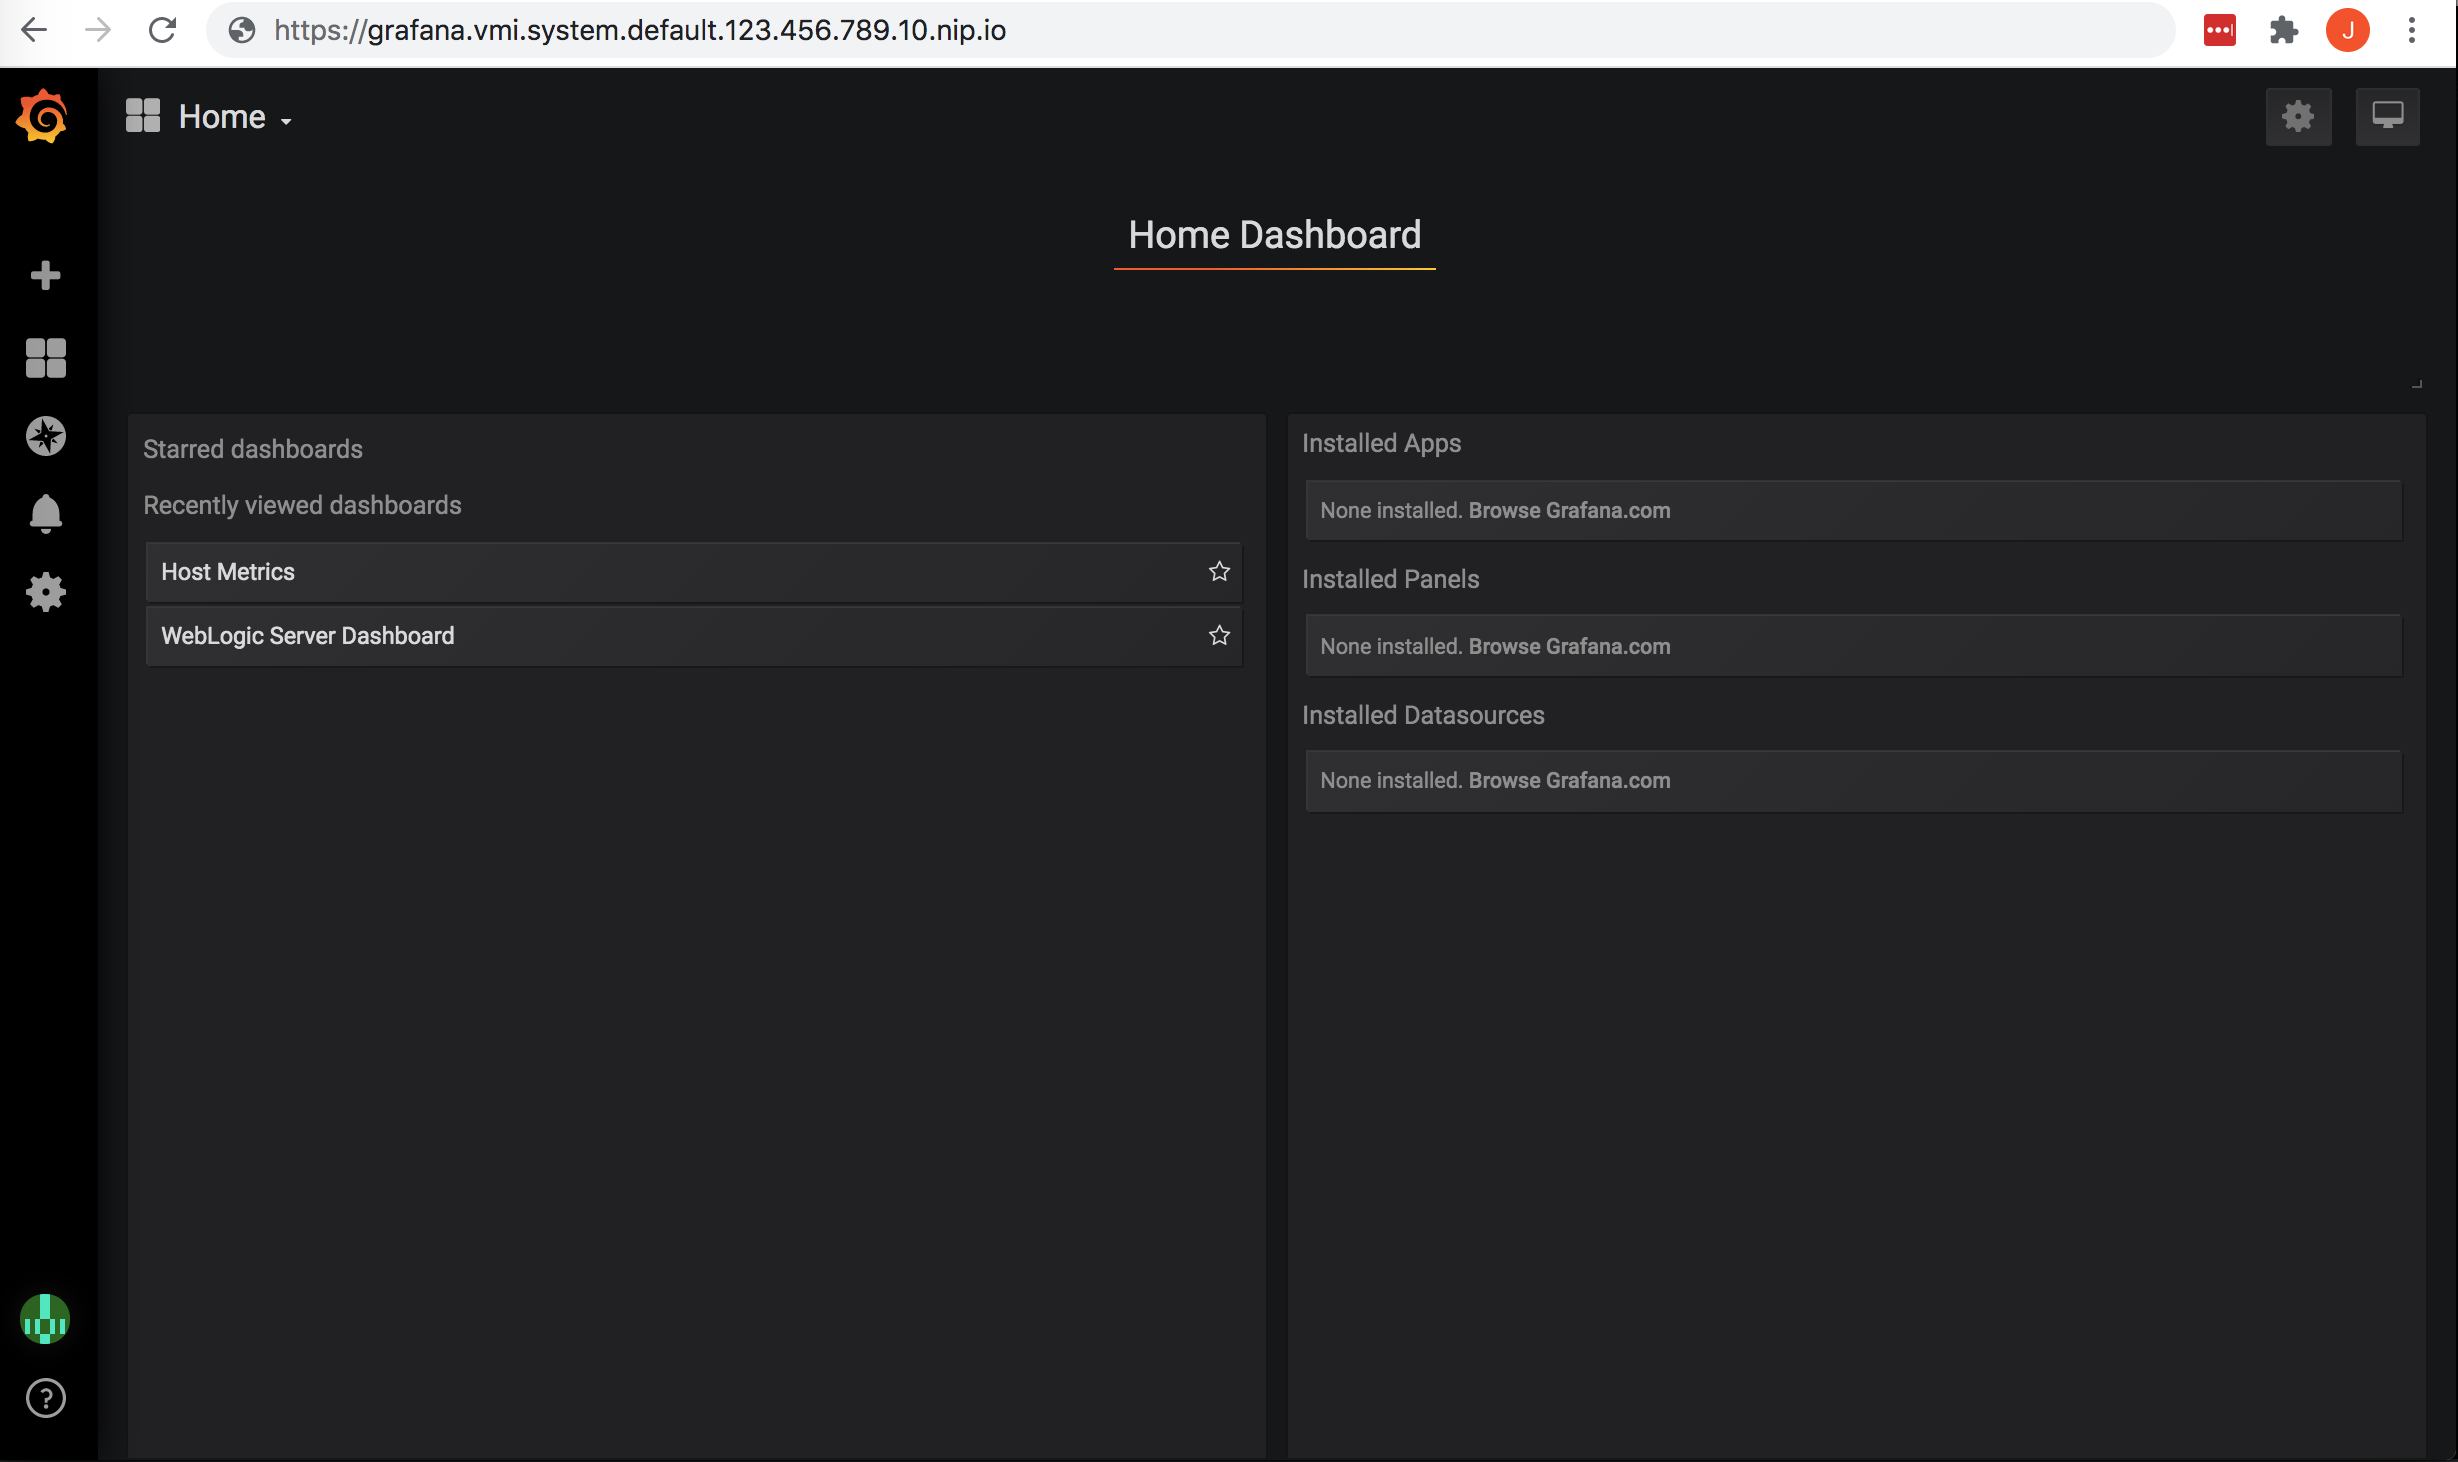
From here, you can select an existing dashboard or create a new dashboard.
To select an existing dashboard, use the drop-down list in the top left corner.
The initial value of this list is Home.
To view host level metrics, select Host Metrics. This will provide system metrics for all
of the nodes in your cluster.
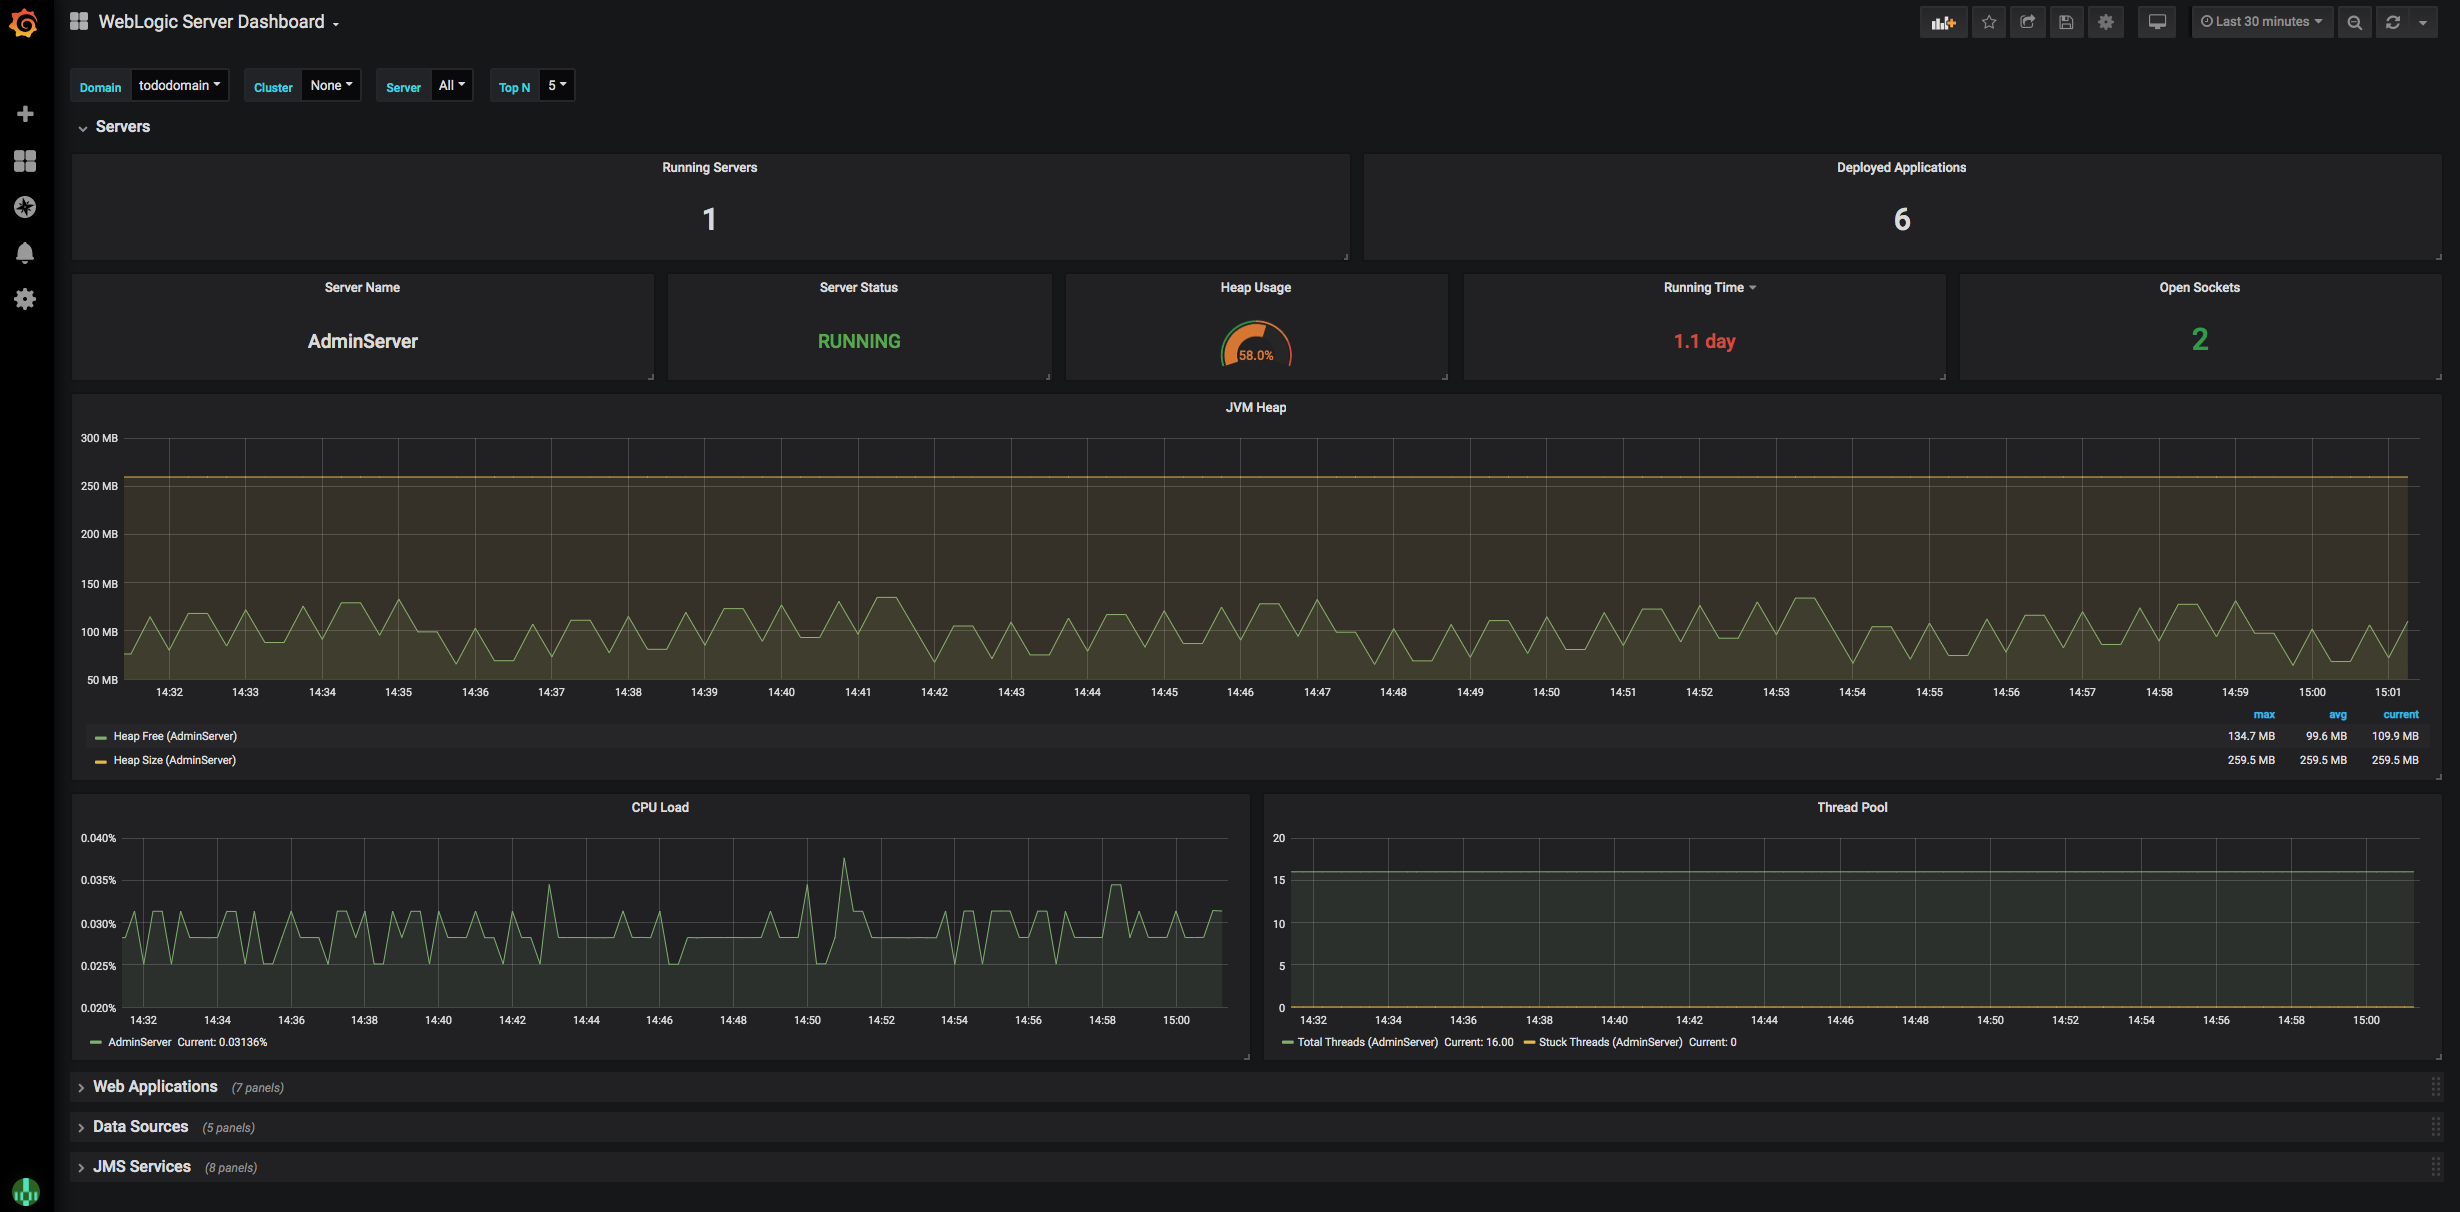
To view the application metrics for the todo-list example application, select WebLogic Server Dashboard
because the todo-list application is a WebLogic application.
Feedback
Was this page helpful?
Glad to hear it! Please tell us how we can improve.
Sorry to hear that. Please tell us how we can improve.