Logging
The Verrazzano logging stack consists of Fluentd, Elasticsearch, and Kibana components.
- Fluentd: a log aggregator that collects, processes, and formats logs from Kubernetes clusters.
- Elasticsearch: a scalable search and analytics engine for storing Kubernetes logs.
- Kibana: a visualization layer that provides a user interface to query and visualize collected logs.
As shown in the following diagram, logs written to stdout by a container running on Kubernetes are picked up by the kubelet service running on that node and written to /var/log/containers.
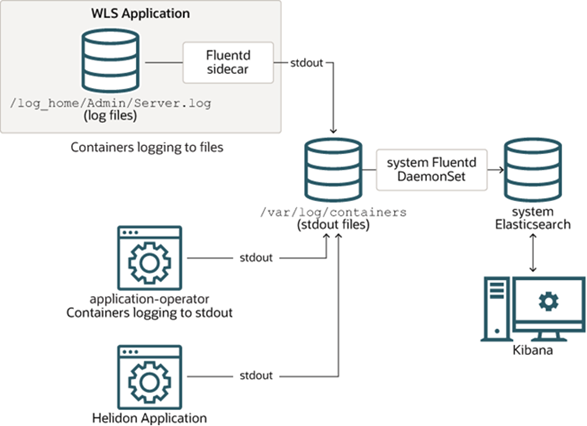
Fluentd sidecar
For components with multiple log streams or that cannot log to stdout, Verrazzano deploys a Fluentd sidecar which parses and translates the log stream. The resulting log is sent to stdout of the sidecar container and then written to /var/log/containers by the kubelet service.
For example, in a WebLogic deployment, AdminServer.log is consumed, translated, and written to stdout by the Fluentd sidecar. You can view these logs using kubectl on the container named fluentd-stdout-sidecar.
$ kubectl logs tododomain-adminserver \
   -n todo-list \
   -c fluentd-stdout-sidecar
The Verrazzano Fluentd Docker image comes with these plug-ins:
- fluent-plugin-concat
- fluent-plugin-dedot_filter
- fluent-plugin-detect-exceptions
- fluent-plugin-elasticsearch
- fluent-plugin-grok-parser
- fluent-plugin-json-in-json-2
- fluent-plugin-kubernetes_metadata_filter
- fluent-plugin-multi-format-parser
- fluent-plugin-parser-cri
- fluent-plugin-prometheus
- fluent-plugin-record-modifier
- fluent-plugin-rewrite-tag-filter
- fluent-plugin-systemd
The Verrazzano Fluentd Docker image also has two local default plug-ins, kubernetes_parser and kubernetes_multiline_parser.
These plug-ins help to parse Kubernetes management log files.
Here are example use cases for these plug-ins:
# ---- fluentd.conf ----
# kubernetes parser
<source>
  @type tail
  path ./kubelet.log
  read_from_head yes
  tag kubelet
  <parse>
     @type multiline_kubernetes
  </parse>
</source>

# kubernetes multi-line parser
<source>
  @type tail
  path ./kubelet.log
  read_from_head yes
  tag kubelet
  <parse>
     @type multiline_kubernetes
  </parse>
</source>
# ----   EOF      ----
For more details, see the Fluentd plugins folder.
Fluentd DaemonSet
Verrazzano deploys a Fluentd DaemonSet which runs one Fluentd replica per node in the verrazzano-system namespace.
Each instance pulls logs from the node’s /var/log/containers directory and writes them to the target Elasticsearch index. The index name is based on the namespace associated with the record, using this format: verrazzano-namespace-<record namespace>.
For example, vmi-system-kibana logs written to /var/log/containers will be pulled by Fluentd and written to Elasticsearch. The index used is named verrazzano-namespace-verrazzano-system because the VMI runs in the verrazzano-system namespace.
The same approach is used for both system and application logs.
Elasticsearch
Verrazzano creates an Elasticsearch deployment as the store and search engine for the logs processed by Fluentd. Records written by Fluentd can be queried using the Elasticsearch REST API.
For example, you can use curl to get all of the Elasticsearch indexes. First, you must get the password for the verrazzano user and the host for the VMI Elasticsearch.
$ PASS=$(kubectl get secret \
    --namespace verrazzano-system verrazzano \
    -o jsonpath={.data.password} | base64 \
    --decode; echo)
$ HOST=$(kubectl get ingress \
    -n verrazzano-system vmi-system-es-ingest \
    -o jsonpath={.spec.rules[0].host})

$ curl -ik \
   --user verrazzano:$PASS https://$HOST//_cat/indices
To see all of the records for a specific index, do the following:
$ INDEX=verrazzano-namespace-todo-list

$ curl -ik \
    --user verrazzano:$PASS https://$HOST/$INDEX/_doc/_search?q=message:*
Verrazzano provides support for Installation Profiles. The production profile (prod), which is the default, provides a 3-node Elasticsearch and persistent storage for the Verrazzano Monitoring Instance (VMI). The development profile (dev) provides a single node Elasticsearch and no persistent storage for the VMI. The managed-cluster profile does not install Elasticsearch or Kibana in the local cluster; all logs are forwarded to the admin cluster’s Elasticsearch instance.
If you want the logs sent to an external Elasticsearch, instead of the default VMI Elasticsearch, specify elasticsearchURL and elasticsearchSecret in the Fluentd Component configuration in your Verrazzano custom resource.
The following is an example of a Verrazzano custom resource to send the logs to the Elasticsearch endpoint https://external-es.default.172.18.0.231.nip.io.
apiVersion: install.verrazzano.io/v1alpha1
kind: Verrazzano
metadata:
  name: default
spec:
  components:
    fluentd:
      elasticsearchURL: https://external-es.default.172.18.0.231.nip.io
      elasticsearchSecret: external-es-secret
Kibana
Kibana is a visualization dashboard for the content indexed on an Elasticsearch cluster. Verrazzano creates a Kibana deployment to provide a user interface for querying and visualizing the log data collected in Elasticsearch.
To access the Kibana console, read Access Verrazzano.
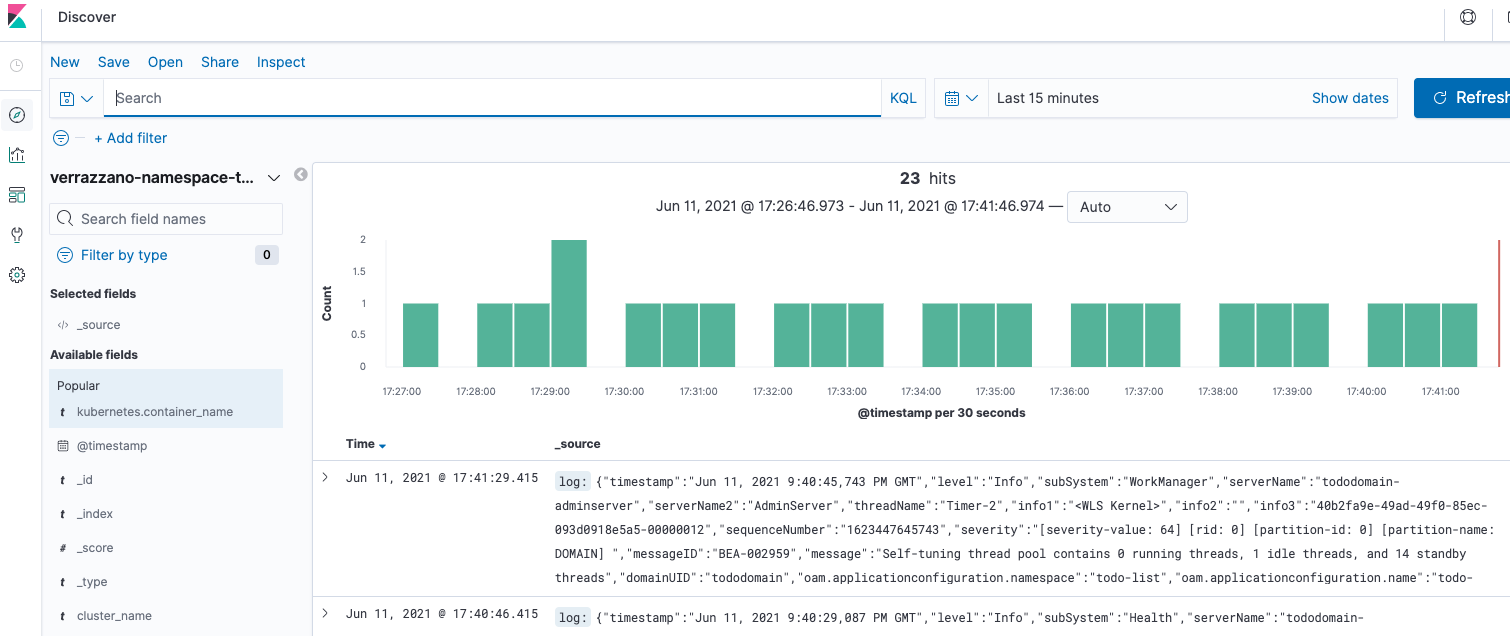
To see the records of an Elasticsearch index through Kibana, create an index pattern to filter for records under the desired index.
For example, to see the log records of a WebLogic application deployed to the todo-list namespace, create an index pattern of verrazzano-namespace-todo-list.
Feedback
Was this page helpful?
Glad to hear it! Please tell us how we can improve.
Sorry to hear that. Please tell us how we can improve.