Verify the Managed Cluster Registration
Verify that managed cluster registration has completed
You can perform all the verification steps on the admin cluster.
-
Verify that the managed cluster can connect to the admin cluster. View the status of the
VerrazzanoManagedClusterresource on the admin cluster, and check whether thelastAgentConnectTime,prometheusHost, andapiUrlfields are populated. This may take up to two minutes after completing the registration steps.# On the admin cluster $ kubectl --kubeconfig $KUBECONFIG_ADMIN --context $KUBECONTEXT_ADMIN \ get vmc managed1 -n verrazzano-mc -o yaml # Sample output showing the status field spec: .... .... status: apiUrl: https://verrazzano.default.172.18.0.211.nip.io conditions: - lastTransitionTime: "2021-07-07T15:49:43Z" message: Ready status: "True" type: Ready lastAgentConnectTime: "2021-07-16T14:47:25Z" prometheusHost: prometheus.vmi.system.default.172.18.0.211.nip.io -
Verify that the managed cluster is successfully registered with Rancher. When you perform the registration steps, Verrazzano also registers the managed cluster with Rancher. View the Rancher console on the admin cluster. If the registration with Rancher was successful, then your cluster will be listed in Rancher’s list of clusters, and will be in the
Activestate. You can find the Rancher console URL for your cluster by following the instructions for Accessing Verrazzano.
Verify that managed cluster metrics are being collected
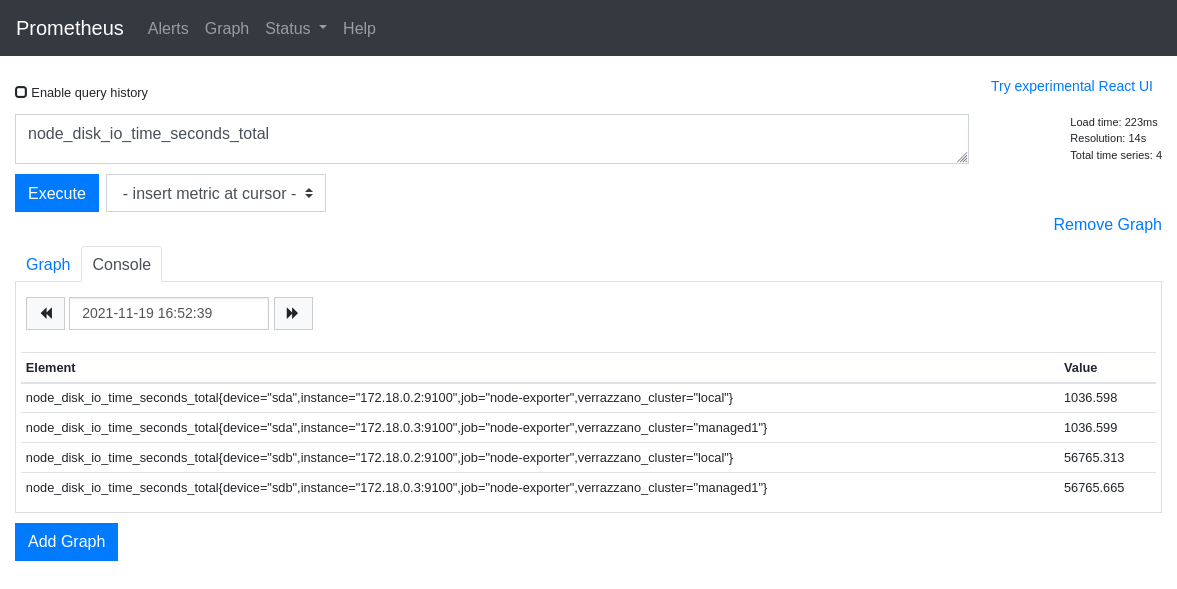
Verify that the admin cluster is collecting metrics from the managed cluster. The Prometheus output will include
records that contain the name of the Verrazzano cluster (labeled as verrazzano_cluster).
You can find the Prometheus console URL for your cluster by following the instructions for Accessing Verrazzano.
Run a query for a metric (for example, node_disk_io_time_seconds_total).
Sample output of a Prometheus query
An alternative approach to using the Prometheus console is to query metrics from the command line. Here is an example of how to obtain Prometheus metrics from the command line. Search the output of the query for responses that have the verrazzano_cluster field set to the name of the managed cluster.
# On the admin cluster
$ prometheusUrl=$(kubectl --kubeconfig $KUBECONFIG_ADMIN --context $KUBECONTEXT_ADMIN \
                 get verrazzano -o jsonpath='{.items[0].status.instance.prometheusUrl}')
$ VZPASS=$(kubectl --kubeconfig $KUBECONFIG_ADMIN --context $KUBECONTEXT_ADMIN \
           get secret verrazzano --namespace verrazzano-system \
           -o jsonpath={.data.password} | base64 --decode; echo)
$ curl -k --user verrazzano:${VZPASS} "${prometheusUrl}/api/v1/query?query=node_disk_io_time_seconds_total"
Verify that managed cluster logs are being collected
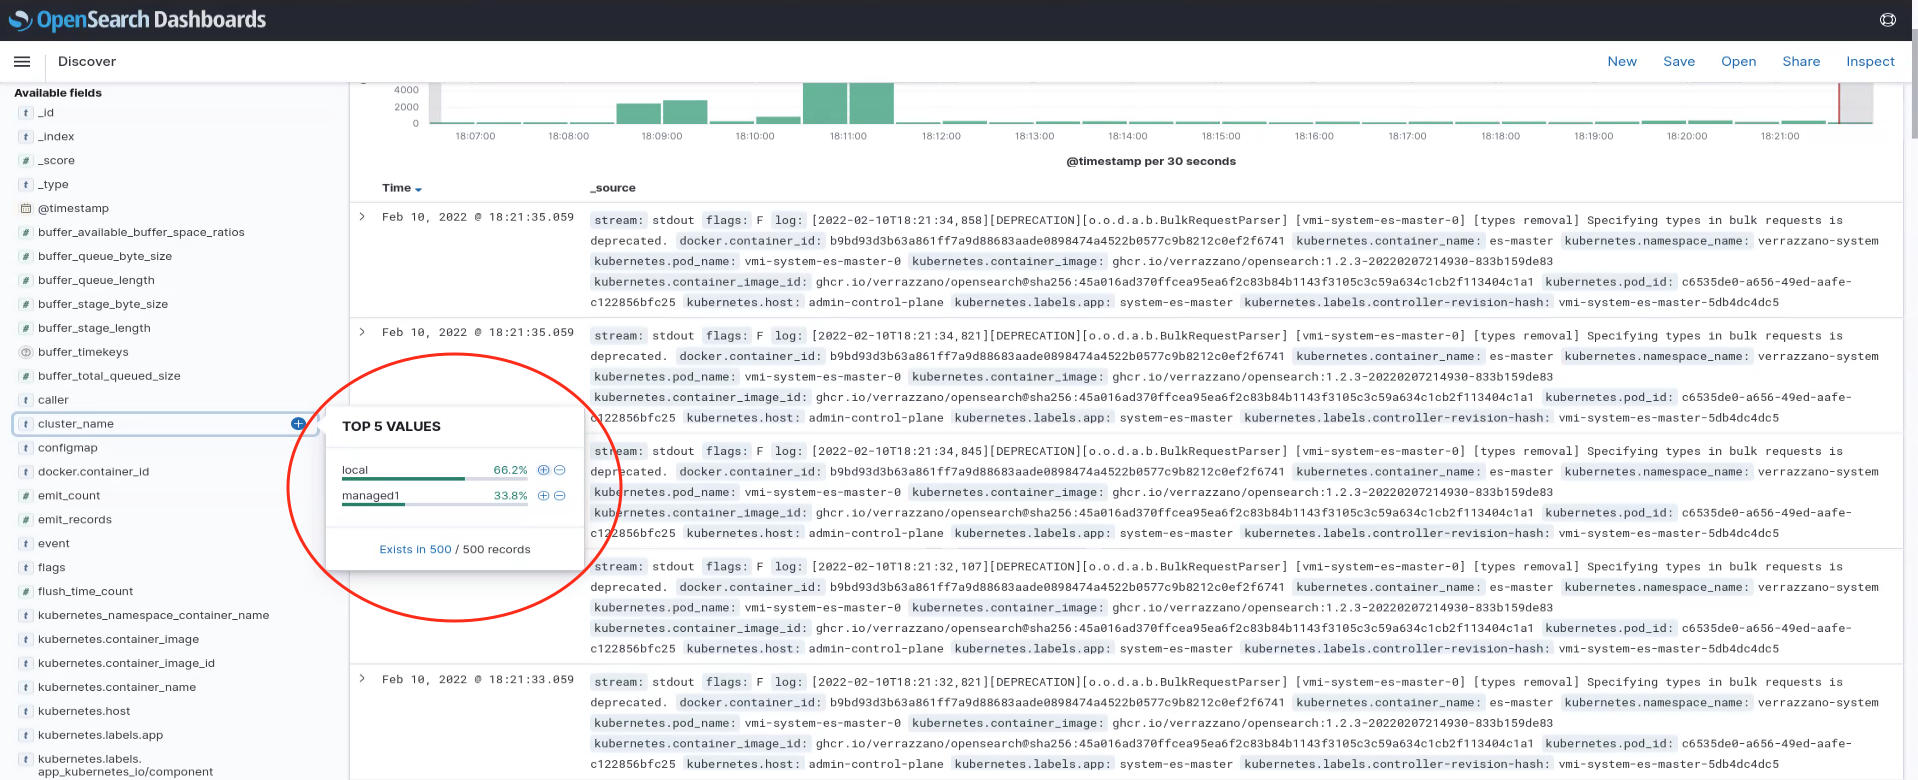
Verify that the admin cluster is collecting logs from the managed cluster. The output will include records which have the name of the managed cluster in the cluster_name field.
You can find the OpenSearch Dashboards URL for your cluster by following the instructions for Accessing Verrazzano.
Searching the verrazzano-system data stream for log records with the cluster_name set to the managed cluster name yields logs for the managed cluster.
Sample output of a OpenSearch Dashboards screen
An alternative approach to using the OpenSearch Dashboards is to query OpenSearch from the command line. Here is an example of how to obtain log records from the command line. Search the output of the query for responses that have the cluster_name field set to the name of the managed cluster.
# On the admin cluster
$ OS_URL=$(kubectl --kubeconfig $KUBECONFIG_ADMIN --context $KUBECONTEXT_ADMIN \
                 get verrazzano -o jsonpath='{.items[0].status.instance.openSearchUrl}')
$ VZPASS=$(kubectl --kubeconfig $KUBECONFIG_ADMIN --context $KUBECONTEXT_ADMIN \
           get secret verrazzano --namespace verrazzano-system \
           -o jsonpath={.data.password} | base64 --decode; echo)
$ curl -k --user verrazzano:${VZPASS} -X POST -H 'kbn-xsrf: true' "${OS_URL}/verrazzano-system/_search?size=25"
Feedback
Was this page helpful?
Glad to hear it! Please tell us how we can improve.
Sorry to hear that. Please tell us how we can improve.