Customize Grafana
Customize Verrazzano Grafana settings
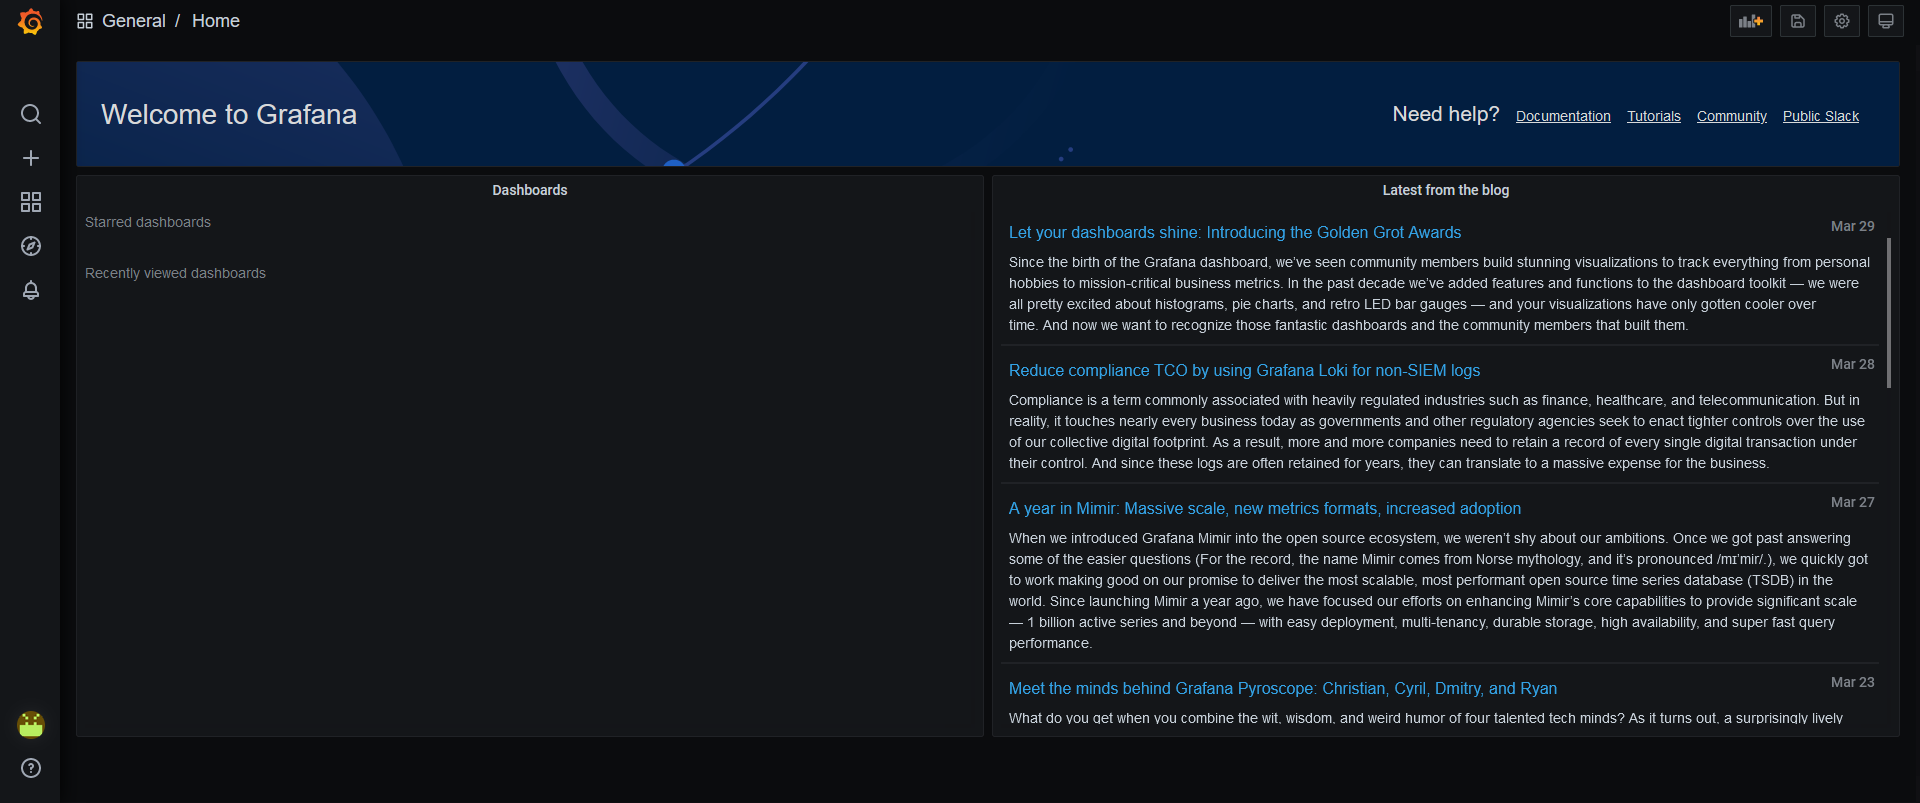
Grafana provides visualization for your Prometheus metric data.
vmi-system-grafana-* in the verrazzano-system namespace.To access Grafana:
Get the host name from the Grafana ingress.
$ kubectl get ingress vmi-system-grafana -n verrazzano-system

# Sample output
NAME                 CLASS    HOSTS                                              ADDRESS          PORTS     AGE
vmi-system-grafana   <none>   grafana.vmi.system.default.123.456.789.10.nip.io   123.456.789.10   80, 443   26h
Get the password for the user verrazzano.
$ kubectl get secret \
    --namespace verrazzano-system verrazzano \
    -o jsonpath={.data.password} | base64 \
    --decode; echo
Access Grafana in a browser using the host name.
Log in using the verrazzano user and the password.
Verrazzano installs a number of preconfigured dashboards in Grafana. These dashboards are organized logically into folders. To view the folders, locate the Dashboards icon and select Manage.
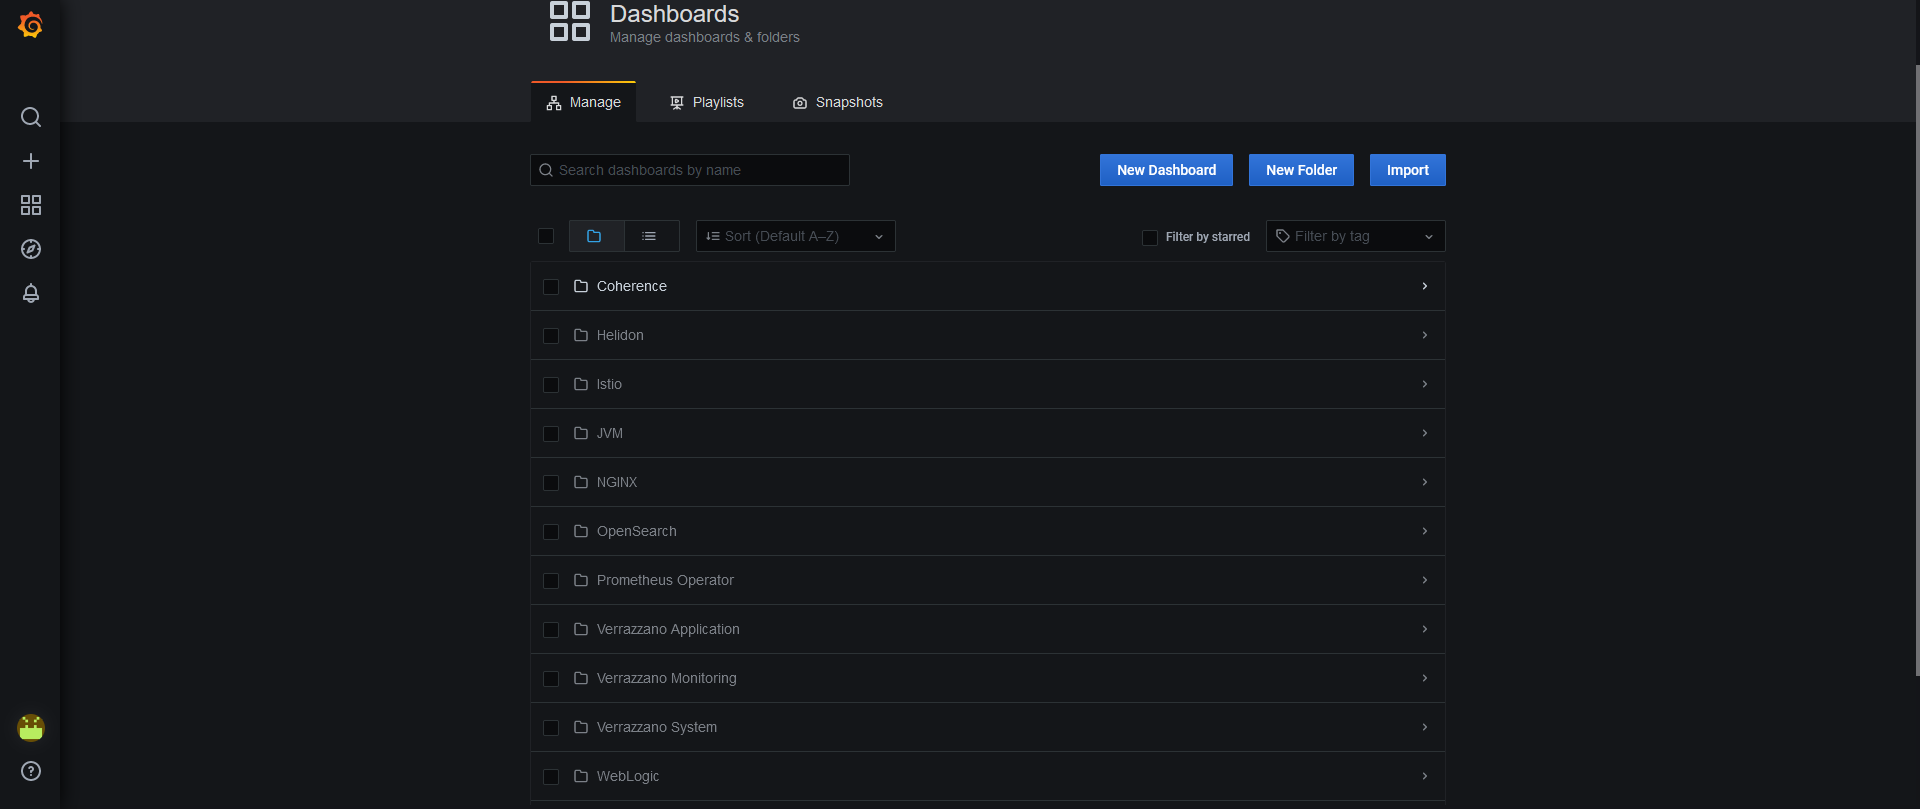
Within each folder, you will find one or more preconfigured dashboards. The dashboards provide a visual representation of metrics for monitoring your applications, the Kubernetes clusters where your applications are running, and Verrazzano itself. You can add to these dashboards, and you can copy and modify the preconfigured dashboards.
Here are the folders and dashboard descriptions:
Coherence - A set of dashboards for monitoring Coherence applications. They provide metrics from Coherence clusters, Caches, Elastic Data, Federation Details, HTTP Servers, Kubernetes, Machines, Cluster Members, Persistence Summary, Proxy Servers, and Coherence Services.Helidon - For Helidon workloads, provides the JVM details for Helidon applications, such as Status, Heap Usage, JVM Heap Sizes, Thread Count, HTTP Requests, and such.Istio - A set of dashboards for monitoring the Verrazzano Istio service mesh and the workloads running in the mesh.JVM - For monitoring applications deployed in Verrazzano.NGINX - For monitoring the Verrazzano system ingress controller and the ingresses created using the ingress controller. Metrics include Controller Request Volume, Controller Connections, Controller Success Rate, Config Reloads, Network Pressure, and such.OpenSearch - Provides metrics from OpenSearch clusters, such as Cluster Health, Shard Details, Index Details, JVM Metrics, and such.Prometheus Operator - Provides metrics for the cluster compute resources, such as CPU Utilization, Memory Limits, and such.WebLogic - For WebLogic workloads, provides WebLogic Server runtime metrics to monitor and diagnose the runtime deployment of WebLogic Server.In addition, there are the following preconfigured Grafana Verrazzano dashboards. These dashboards are located in Verrazzano Application, Verrazzano Monitoring, and Verrazzano System folders:
Verrazzano Application contains the Application Status dashboard. This dashboard provides information on the overall health and performance of OAM applications that are deployed in Verrazzano and the details of the running pods. You can filter this information based on cluster, application, and component.
Applications. You can select the specific application that you want to monitor and select which application metrics to view. Metrics are available in three rows:
Summary provides CPU and memory usage and pod status.Storage provides disk and PVC (Persistent Volume Claims) usage.Requests provides HTTP requests and request metrics.Verrazzano Monitoring contains dashboards for monitoring the Kubernetes clusters where Verrazzano is running:
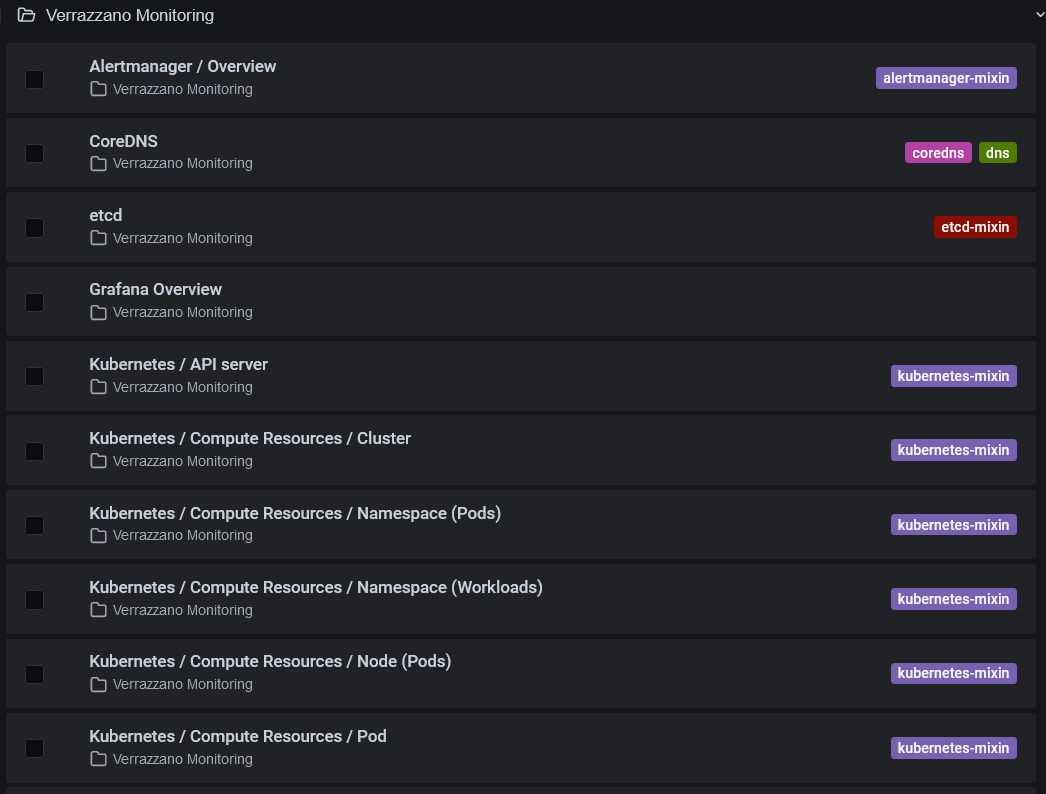
alertmanager-mixin displays alerts created by Alertmanager, including the successful and invalid notifications sent by Alertmanager.etcd-mixin provides cluster metrics and shows additional information, such as active streams, RPC rate, database size, memory usage, client traffic, peer traffic, and such.kubernetes-mixin provides CPU, memory and network metrics based on cluster, pod, workload type, and nodes; network bandwidth based on cluster, pod, workload type, and nodes; persistent volume usage; and metrics for proxy and scheduler.node-exporter-mixin provides node level status for CPU, memory, disk, and network usage.
The following graphic shows some Verrazzano Monitoring dashboards:
Verrazzano System has a set of dashboards that provide information on the health of all Verrazzano system components and the resource usage of Kubernetes resources across clusters.
Resource Usage Detailed gives a detailed view of the resource usage for each of the Verrazzano system components, such as the application operator, cluster operator, monitoring operator, and platform operator. You can filter information based on cluster, component, and so on.Resource Usage Summary gives a summary of the resource usage that can be viewed for all components or for a specific component. You can filter information based on cluster, component, and so on. Metrics are available in three rows:
Summary provides CPU and memory usage and pod status.Storage provides disk and PVC (Persistent Volume Claims) usage.Requests provides HTTP requests and request metrics.System Health gives the health for all Verrazzano system components that can be viewed for local clusters or any other registered clusters.Verrazzano enables dynamic discovery of Grafana dashboards. Using this feature, you can package the dashboard configuration and settings as a Kubernetes ConfigMap, and then deploy it individually or along with your application.
To configure a dashboard as a ConfigMap:
Create a dashboard as a JSON file. Or, you can export an existing Grafana dashboard as a JSON file. See Manage Dashboards.
Create a ConfigMap on the same cluster running Grafana that includes:
The label, grafana_dashboard:"1", so that Grafana discovers the dashboard.
The JSON code that defines and configures the dashboard (the dashboard JSON from step 1).
Optionally, a k8s-sidecar-target-directory annotation, which specifies the Grafana folder name in which you want the dashboard to appear. The value of the annotation is the Grafana folder name. If not specified, the dashboard will appear in the default Grafana folder.
Here is an example dashboard ConfigMap.
apiVersion: v1
kind: ConfigMap
metadata:
  annotations:
    k8s-sidecar-target-directory: My App Dashboards
  labels:
    grafana_dashboard: "1"
  name: app-dashboard
  namespace: app
data:
  app_dashboard.json: |-
    {
      "title": "My App Dashboard",
      "uid": "Q4Bkkx",
      "version": 2,
      "panels": [
        {
          ...
        }
      ...
    }
After the ConfigMap is created, the dashboard gets loaded in Grafana.
Alternatively, you can create a ConfigMap from a file using kubectl create configmap, or generate ConfigMap from files. See Create a ConfigMap.
You can use dashboard ConfigMaps to deploy custom dashboards; these dashboards can be modified but cannot be saved in Grafana. If you want to modify the dashboard, then either update the ConfigMap or save the dashboard to a new location from the Grafana console.
Customize Verrazzano Grafana settings
Was this page helpful?
Glad to hear it! Please tell us how we can improve.
Sorry to hear that. Please tell us how we can improve.